There are many sites out there that document how to monitor Hyper-V performance, but only a few of them have any detail on the actual setup and results of the monitoring. Perhaps this post (and the next one coming) will assist you, or perhaps it will only be of benefit for my personal reference documentation.
Its sad to admit, but until this month I hadn’t spent any large amount of time looking at my Hyper-V cluster to check for performance issues because I’ve been so busy. With the addition of new staff at work (invaluable!) I’ve had the chance to get caught up on actual system administration.
In addition to the necessity of doing this because it’s the right thing to do, there’s a new software implementation that is being considered, and I wanted to make sure I wasn’t over-selling our cluster capabilities.
Real-time active monitoring
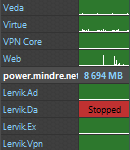
Hyper-V Windows Gadget: Made by Tore Lervik. I found this tool about 2 weeks after my initial implementation. Right now I’m only using it for active monitoring of the guest CPU performance, but it has many other features that make it worth downloading.
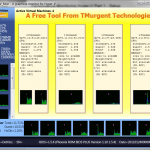
Hyper-V Mon.exe: This was discovered while reading a post at the excellent Hyper-V.nu by Peter Noorderijk. The actual post detailing this (and other monitoring which I’ll get to) is here. I really like this tool because it gives the actual CPU utilization of your hosts, in addition to other data.
Scheduled Monitoring and Analysis
A very useful tool that I discovered through the Hyper-V.Nu blog post is the “Performance Analysis of Logs (PAL)” tool. It can be found here on codeplex. This tool provides the ability to set a Performance Counter profile, export it to a Data Collector Set, and then import the results for analysis.
I won’t detail how to set up and use the tool in full here, as it’s been covered by Peter at the Hyper-V.nu link above, however there are a couple things to mention.
If you’re trying to use this with Hyper-V Server (as opposed to Windows Server with Hyper-V role) you’ll find that you can’t just run Performance Monitor to import that data collector set; instead you’ll need to use the Logman command.
But before you do that, you must modify your exported XML template in a text editor, because the Logman command is going to throw an error unless you don’t. When you open it up, look at line 5 & 6:
<Name>PAL_Microsoft_Hyper-V_R2_SP1</Name> <DisplayName>@%systemroot%\system32\wdc.dll,#10026</DisplayName> <Description>@%systemroot%\system32\wdc.dll,#10027</Description> |
For some reason, logman doesn’t like the dynamic DisplayName and Description that are used by default. Change these to some static value, and save the xml file.
Next, copy the xml file to your Hyper-V host, and then remote into the host and run the following from the command line:
logman import Hyper-V_Monitor -xml "c:\Hyper-v_Counters.xml"
Then you can start the counters with:
logman start Hyper-V_Monitor
By default the results will be saved in C:\PerfLogs\System\Performance on your host. If you want to schedule the start and stop, you could use schtasks.exe to schedule the logman command.
Once you have the output from performance monitor, you can load it into the PAL tool as described at Hyper-V.nu, and view your results.
In part two, I’ll review my results and what I’ve found about them.

