Azure Managed Prometheus and Grafana with Terraform – part 3

This is part 3 in learning about monitoring solutions for an Azure Kubernetes Service (AKS), using Azure Managed Prometheus and Azure Managed Grafana.

In this post we are going to use Terraform to finish the implementation of gathering Prometheus metrics for the ingress-nginx controller, which will grant an application-centric view of metrics.

The source code for this part 3 post can be found here in my GitHub repo: aks-prometheus-grafana (part 3)

My criteria for success was to have a populated dashboard in Grafana for ingress-nginx metrics. The source code for ingress-nginx has two different dashboards that can be imported into Grafana: https://github.com/kubernetes/ingress-nginx/tree/main/deploy/grafana/dashboards

Now having access to Azure Managed Grafana, I used the web portal to create an API token that I could pass to Terraform.

Within my Terraform config, I defined a Grafana provider, and then downloaded the JSON files for the dashboards and referenced them as a dashboard resource:

## ---------------------------------------------------
# Grafana Dashboards
## ---------------------------------------------------
provider "grafana" {
  url  = azurerm_dashboard_grafana.default.endpoint
  auth = "securely pass api token"
}
resource "grafana_dashboard" "nginxmetrics" {
  depends_on = [ azurerm_dashboard_grafana.default ]
  config_json = file("nginx.json")
}
resource "grafana_dashboard" "requestHandlingPerformance" {
  depends_on = [ azurerm_dashboard_grafana.default ]
  config_json = file("requestHandlingPerformance.json")
}

I could now see these dashboards in my Grafana instance, but they were empty:

Taking the next step to solve this problem really bogged down based on my lack of understanding of Prometheus and how it is configured. The default installation of Azure Managed Prometheus and Grafana doesn’t do anything with ingress-nginx metrics out of the box, so I began trying to identify how to get it working. Following through Microsoft Docs (which are typically really great) I came across this page: https://learn.microsoft.com/en-us/azure/azure-monitor/essentials/prometheus-metrics-scrape-configuration

This was quite overwhelming to me. Many options are described, none of which I had knowledge about, or had good use cases defined in the doc page for why you would choose one or the other. There is no indication or example of using these patterns either, which doesn’t make for a good starting point.

I looked next at the pod-annotation-based-scraping setting, found within the “ama-metrics-settings-configmap.yaml” file. I set this to include the name of my workload namespace, as well as where I deployed ingress-nginx: podannotationnamespaceregex = "test|ingress-nginx"

After re-running my Terraform and waiting for the metrics pods to reload (judging by the restart count by a kubectl get pods, this didn’t do anything; the dashboards remained blank.

I looked at the Azure Prometheus troubleshooting doc to get the config interface of Prometheus port forwarded, and after reaching this interface in a web browser, I didn’t see any new targets listed beyond the existing node ones.

After some searching and reading, I came across this post: https://medium.com/microsoftazure/automating-managed-prometheus-and-grafana-with-terraform-for-scalable-observability-on-azure-4e5c5409a6b1
It had an example regarding a prometheus scrape config, which was mentioned in the Azure docs. This makes sense, in that what I originally configured above was a scoping statement for where this scrape config would be applied.

This understanding led me to the ingress-nginx docs which have a sample prometheus scrape config!
https://github.com/kubernetes/ingress-nginx/blob/main/deploy/prometheus/prometheus.yaml

Following the Azure doc for prometheus-metric-scrape-configuration, I created a new file named ama-metrics-prometheus-config-configmap.yaml and populated it with the scrape config found within the ingress-nginx repository.

kind: ConfigMap
apiVersion: v1
data:
  prometheus-config: |-
    global:
      scrape_interval: 30s
    scrape_configs:
      - job_name: 'kubernetes-pods'

        kubernetes_sd_configs:
        - role: pod

        relabel_configs:
        # Scrape only pods with the annotation: prometheus.io/scrape = true
        - source_labels: [__meta_kubernetes_pod_annotation_prometheus_io_scrape]
          action: keep
          regex: true

        # If prometheus.io/path is specified, scrape this path instead of /metrics
        - source_labels: [__meta_kubernetes_pod_annotation_prometheus_io_path]
          action: replace
          target_label: __metrics_path__
          regex: (.+)

        # If prometheus.io/port is specified, scrape this port instead of the default
        - source_labels: [__address__, __meta_kubernetes_pod_annotation_prometheus_io_port]
          action: replace
          regex: ([^:]+)(?::\d+)?;(\d+)
          replacement: $1:$2
          target_label: __address__

        # If prometheus.io/scheme is specified, scrape with this scheme instead of http
        - source_labels: [__meta_kubernetes_pod_annotation_prometheus_io_scheme]
          action: replace
          regex: (http|https)
          target_label: __scheme__

        # Include the pod namespace as a label for each metric
        - source_labels: [__meta_kubernetes_namespace]
          action: replace
          target_label: kubernetes_namespace

        # Include the pod name as a label for each metric
        - source_labels: [__meta_kubernetes_pod_name]
          action: replace
          target_label: kubernetes_pod_name

        # [Optional] Include all pod labels as labels for each metric
        - action: labelmap
          regex: __meta_kubernetes_pod_label_(.+)
metadata:
  name: ama-metrics-prometheus-config
  namespace: kube-system

I deployed this through Terraform with another kubectl_manifest resource, and then forced traffic to my workloads with a looping Invoke-WebRequest in Powershell.

This succeeded! Very quickly I began to see metrics appear within my Grafana dashboards:

Now when I checked the Prometheus Targets debugging interface, I found an addition for ingress-nginx. You’ll note I also have a “down” entry there for my test workload, which doesn’t have a metrics interface for scraping (but was included in my podannotationnamespaceregex earlier).

Originally I thought that I was going to encounter namespace boundary problems, because the Monitoring docs for ingress-nginx talk about this limitation when using pod scraping. I thought I would be stuck because I am deploying in separate namespaces which indicates the need to use ServiceMonitor objects; and unfortunately the AKS Metrics add-on very-specifically doesn’t support Prometheus Operator CRDs like ServiceMonitor, so we need to use PodAnnotation scraping.

Fortunately after adding the scrape configuration, there wasn’t any further action that I needed to take, so perhaps the described limitation of Prometheus reaching across namespaces is modified by the default Azure deployment.

I’ll drop a link for one more helpful resource, which uses the Prometheus Operator installation and Service Monitors, but helped me gain some understanding of the components of this system: https://techcommunity.microsoft.com/t5/azure-stack-blog/notes-from-the-field-nginx-ingress-controller-for-production-on/ba-p/3781350

Azure Managed Prometheus and Grafana with Terraform – part 2

This is part 2 in learning about monitoring solutions for an Azure Kubernetes Service (AKS), using Azure Managed Prometheus and Azure Managed Grafana.

In this post we are going to use Terraform to configure the Azure Prometheus and Grafana solutions, connect them to our previously created AKS cluster, and look at what metrics we get out of the box.

The source code for this part 2 post can be found here in my GitHub repo: aks-prometheus-grafana (part 2)

Microsoft’s support for deploying a fully integrated solution through infrastructure-as-code is lacking here, in non-obvious ways which I’ll walk through. There is an onboarding guide available, which surprisingly does have example Terraform code; not just Azure CLI commands as I typically see. However, the Terraform examples are still using the AzApi resources for the Prometheus rule groups, despite there existing a Terraform resource for this now in azurerm_monitor_alert_prometheus_rule_group.

I deviate from the code examples because it is using a lot of static string variable references to link the Monitor Workspace (the managed Prometheus resource) with the cluster and Grafana, where I prefer to use Terraform references instead.

We’ll begin by creating our primary resources:

## ---------------------------------------------------
# Managed Prometheus
## ---------------------------------------------------
resource "azurerm_monitor_workspace" "default" {
  name                = "prom-test"
  resource_group_name = azurerm_resource_group.default.name
  location            = azurerm_resource_group.default.location
}
## ---------------------------------------------------
# Managed Grafana
## ---------------------------------------------------
resource "azurerm_dashboard_grafana" "default" {
  name                              = "graf-test"
  resource_group_name               = azurerm_resource_group.default.name
  location                          = azurerm_resource_group.default.location
  api_key_enabled                   = true
  deterministic_outbound_ip_enabled = false
  public_network_access_enabled     = true
  identity {
    type = "SystemAssigned"
  }
  azure_monitor_workspace_integrations {
    resource_id = azurerm_monitor_workspace.default.id
  }
}

# Add required role assignment over resource group containing the Azure Monitor Workspace
resource "azurerm_role_assignment" "grafana" {
  scope                = azurerm_resource_group.default.id
  role_definition_name = "Monitoring Reader"
  principal_id         = azurerm_dashboard_grafana.default.identity[0].principal_id
}

# Add role assignment to Grafana so an admin user can log in
resource "azurerm_role_assignment" "grafana-admin" {
  scope                = azurerm_dashboard_grafana.default.id
  role_definition_name = "Grafana Admin"
  principal_id         = var.adminGroupObjectIds[0]
}

# Output the grafana url for usability
output "grafana_url" {
  value = azurerm_dashboard_grafana.default.endpoint
}

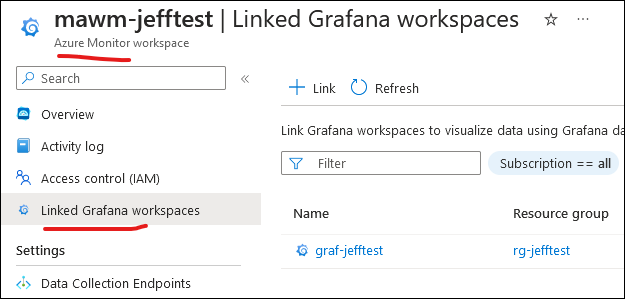
This will tie the Azure Monitor Workspace (effectively, prometheus data store) with Grafana, and automatically include Prometheus as a Grafana data source; after deployment you can see the linked components:

However the code above is only a small portion of what is required to actually connect to the AKS cluster. This is where the Terraform examples from Azure really came in handy, because it outlined the required components, like the section below. Note this includes a large block for the prometheus rule groups, where I have only included the Linux-relevant ones (we’ll get to the Windows integration later).

resource "azurerm_monitor_data_collection_endpoint" "dce" {
  name                = "MSProm-${azurerm_monitor_workspace.default.location}-${azurerm_kubernetes_cluster.default.name}"
  resource_group_name = azurerm_resource_group.default.name
  location            = azurerm_monitor_workspace.default.location
  kind                = "Linux"
}

resource "azurerm_monitor_data_collection_rule" "dcr" {
  name                        = "MSProm-${azurerm_monitor_workspace.default.location}-${azurerm_kubernetes_cluster.default.name}"
  resource_group_name         = azurerm_resource_group.default.name
  location                    = azurerm_monitor_workspace.default.location
  data_collection_endpoint_id = azurerm_monitor_data_collection_endpoint.dce.id
  kind                        = "Linux"
  destinations {
    monitor_account {
      monitor_account_id = azurerm_monitor_workspace.default.id
      name               = "MonitoringAccount1"
    }
  }
  data_flow {
    streams      = ["Microsoft-PrometheusMetrics"]
    destinations = ["MonitoringAccount1"]
  }
  data_sources {
    prometheus_forwarder {
      streams = ["Microsoft-PrometheusMetrics"]
      name    = "PrometheusDataSource"
    }
  }
  description = "DCR for Azure Monitor Metrics Profile (Managed Prometheus)"
  depends_on = [
    azurerm_monitor_data_collection_endpoint.dce
  ]
}

resource "azurerm_monitor_data_collection_rule_association" "dcra" {
  name                    = "MSProm-${azurerm_monitor_workspace.default.location}-${azurerm_kubernetes_cluster.default.name}"
  target_resource_id      = azurerm_kubernetes_cluster.default.id
  data_collection_rule_id = azurerm_monitor_data_collection_rule.dcr.id
  description             = "Association of data collection rule. Deleting this association will break the data collection for this AKS Cluster."
  depends_on = [
    azurerm_monitor_data_collection_rule.dcr
  ]
}
resource "azapi_resource" "NodeRecordingRulesRuleGroup" {
  type      = "Microsoft.AlertsManagement/prometheusRuleGroups@2023-03-01"
  name      = "NodeRecordingRulesRuleGroup-${azurerm_kubernetes_cluster.default.name}"
  location  = azurerm_monitor_workspace.default.location
  parent_id = azurerm_resource_group.default.id
  body = jsonencode({
    "properties" : {
      "scopes" : [
        azurerm_monitor_workspace.default.id
      ],
      "clusterName" : azurerm_kubernetes_cluster.default.name,
      "interval" : "PT1M",
      "rules" : [
        {
          "record" : "instance:node_num_cpu:sum",
          "expression" : "count without (cpu, mode) (  node_cpu_seconds_total{job=\"node\",mode=\"idle\"})"
        },
        {
          "record" : "instance:node_cpu_utilisation:rate5m",
          "expression" : "1 - avg without (cpu) (  sum without (mode) (rate(node_cpu_seconds_total{job=\"node\", mode=~\"idle|iowait|steal\"}[5m])))"
        },
        {
          "record" : "instance:node_load1_per_cpu:ratio",
          "expression" : "(  node_load1{job=\"node\"}/  instance:node_num_cpu:sum{job=\"node\"})"
        },
        {
          "record" : "instance:node_memory_utilisation:ratio",
          "expression" : "1 - (  (    node_memory_MemAvailable_bytes{job=\"node\"}    or    (      node_memory_Buffers_bytes{job=\"node\"}      +      node_memory_Cached_bytes{job=\"node\"}      +      node_memory_MemFree_bytes{job=\"node\"}      +      node_memory_Slab_bytes{job=\"node\"}    )  )/  node_memory_MemTotal_bytes{job=\"node\"})"
        },
        {
          "record" : "instance:node_vmstat_pgmajfault:rate5m",
          "expression" : "rate(node_vmstat_pgmajfault{job=\"node\"}[5m])"
        },
        {
          "record" : "instance_device:node_disk_io_time_seconds:rate5m",
          "expression" : "rate(node_disk_io_time_seconds_total{job=\"node\", device!=\"\"}[5m])"
        },
        {
          "record" : "instance_device:node_disk_io_time_weighted_seconds:rate5m",
          "expression" : "rate(node_disk_io_time_weighted_seconds_total{job=\"node\", device!=\"\"}[5m])"
        },
        {
          "record" : "instance:node_network_receive_bytes_excluding_lo:rate5m",
          "expression" : "sum without (device) (  rate(node_network_receive_bytes_total{job=\"node\", device!=\"lo\"}[5m]))"
        },
        {
          "record" : "instance:node_network_transmit_bytes_excluding_lo:rate5m",
          "expression" : "sum without (device) (  rate(node_network_transmit_bytes_total{job=\"node\", device!=\"lo\"}[5m]))"
        },
        {
          "record" : "instance:node_network_receive_drop_excluding_lo:rate5m",
          "expression" : "sum without (device) (  rate(node_network_receive_drop_total{job=\"node\", device!=\"lo\"}[5m]))"
        },
        {
          "record" : "instance:node_network_transmit_drop_excluding_lo:rate5m",
          "expression" : "sum without (device) (  rate(node_network_transmit_drop_total{job=\"node\", device!=\"lo\"}[5m]))"
        }
      ]
    }
  })

  schema_validation_enabled = false
  ignore_missing_property   = false
}

resource "azapi_resource" "KubernetesReccordingRulesRuleGroup" {
  type      = "Microsoft.AlertsManagement/prometheusRuleGroups@2023-03-01"
  name      = "KubernetesReccordingRulesRuleGroup-${azurerm_kubernetes_cluster.default.name}"
  location  = azurerm_monitor_workspace.default.location
  parent_id = azurerm_resource_group.default.id
  body = jsonencode({
    "properties" : {
      "scopes" : [
        azurerm_monitor_workspace.default.id
      ],
      "clusterName" : azurerm_kubernetes_cluster.default.name,
      "interval" : "PT1M",
      "rules" : [
        {
          "record" : "node_namespace_pod_container:container_cpu_usage_seconds_total:sum_irate",
          "expression" : "sum by (cluster, namespace, pod, container) (  irate(container_cpu_usage_seconds_total{job=\"cadvisor\", image!=\"\"}[5m])) * on (cluster, namespace, pod) group_left(node) topk by (cluster, namespace, pod) (  1, max by(cluster, namespace, pod, node) (kube_pod_info{node!=\"\"}))"
        },
        {
          "record" : "node_namespace_pod_container:container_memory_working_set_bytes",
          "expression" : "container_memory_working_set_bytes{job=\"cadvisor\", image!=\"\"}* on (namespace, pod) group_left(node) topk by(namespace, pod) (1,  max by(namespace, pod, node) (kube_pod_info{node!=\"\"}))"
        },
        {
          "record" : "node_namespace_pod_container:container_memory_rss",
          "expression" : "container_memory_rss{job=\"cadvisor\", image!=\"\"}* on (namespace, pod) group_left(node) topk by(namespace, pod) (1,  max by(namespace, pod, node) (kube_pod_info{node!=\"\"}))"
        },
        {
          "record" : "node_namespace_pod_container:container_memory_cache",
          "expression" : "container_memory_cache{job=\"cadvisor\", image!=\"\"}* on (namespace, pod) group_left(node) topk by(namespace, pod) (1,  max by(namespace, pod, node) (kube_pod_info{node!=\"\"}))"
        },
        {
          "record" : "node_namespace_pod_container:container_memory_swap",
          "expression" : "container_memory_swap{job=\"cadvisor\", image!=\"\"}* on (namespace, pod) group_left(node) topk by(namespace, pod) (1,  max by(namespace, pod, node) (kube_pod_info{node!=\"\"}))"
        },
        {
          "record" : "cluster:namespace:pod_memory:active:kube_pod_container_resource_requests",
          "expression" : "kube_pod_container_resource_requests{resource=\"memory\",job=\"kube-state-metrics\"}  * on (namespace, pod, cluster)group_left() max by (namespace, pod, cluster) (  (kube_pod_status_phase{phase=~\"Pending|Running\"} == 1))"
        },
        {
          "record" : "namespace_memory:kube_pod_container_resource_requests:sum",
          "expression" : "sum by (namespace, cluster) (    sum by (namespace, pod, cluster) (        max by (namespace, pod, container, cluster) (          kube_pod_container_resource_requests{resource=\"memory\",job=\"kube-state-metrics\"}        ) * on(namespace, pod, cluster) group_left() max by (namespace, pod, cluster) (          kube_pod_status_phase{phase=~\"Pending|Running\"} == 1        )    ))"
        },
        {
          "record" : "cluster:namespace:pod_cpu:active:kube_pod_container_resource_requests",
          "expression" : "kube_pod_container_resource_requests{resource=\"cpu\",job=\"kube-state-metrics\"}  * on (namespace, pod, cluster)group_left() max by (namespace, pod, cluster) (  (kube_pod_status_phase{phase=~\"Pending|Running\"} == 1))"
        },
        {
          "record" : "namespace_cpu:kube_pod_container_resource_requests:sum",
          "expression" : "sum by (namespace, cluster) (    sum by (namespace, pod, cluster) (        max by (namespace, pod, container, cluster) (          kube_pod_container_resource_requests{resource=\"cpu\",job=\"kube-state-metrics\"}        ) * on(namespace, pod, cluster) group_left() max by (namespace, pod, cluster) (          kube_pod_status_phase{phase=~\"Pending|Running\"} == 1        )    ))"
        },
        {
          "record" : "cluster:namespace:pod_memory:active:kube_pod_container_resource_limits",
          "expression" : "kube_pod_container_resource_limits{resource=\"memory\",job=\"kube-state-metrics\"}  * on (namespace, pod, cluster)group_left() max by (namespace, pod, cluster) (  (kube_pod_status_phase{phase=~\"Pending|Running\"} == 1))"
        },
        {
          "record" : "namespace_memory:kube_pod_container_resource_limits:sum",
          "expression" : "sum by (namespace, cluster) (    sum by (namespace, pod, cluster) (        max by (namespace, pod, container, cluster) (          kube_pod_container_resource_limits{resource=\"memory\",job=\"kube-state-metrics\"}        ) * on(namespace, pod, cluster) group_left() max by (namespace, pod, cluster) (          kube_pod_status_phase{phase=~\"Pending|Running\"} == 1        )    ))"
        },
        {
          "record" : "cluster:namespace:pod_cpu:active:kube_pod_container_resource_limits",
          "expression" : "kube_pod_container_resource_limits{resource=\"cpu\",job=\"kube-state-metrics\"}  * on (namespace, pod, cluster)group_left() max by (namespace, pod, cluster) ( (kube_pod_status_phase{phase=~\"Pending|Running\"} == 1) )"
        },
        {
          "record" : "namespace_cpu:kube_pod_container_resource_limits:sum",
          "expression" : "sum by (namespace, cluster) (    sum by (namespace, pod, cluster) (        max by (namespace, pod, container, cluster) (          kube_pod_container_resource_limits{resource=\"cpu\",job=\"kube-state-metrics\"}        ) * on(namespace, pod, cluster) group_left() max by (namespace, pod, cluster) (          kube_pod_status_phase{phase=~\"Pending|Running\"} == 1        )    ))"
        },
        {
          "record" : "namespace_workload_pod:kube_pod_owner:relabel",
          "expression" : "max by (cluster, namespace, workload, pod) (  label_replace(    label_replace(      kube_pod_owner{job=\"kube-state-metrics\", owner_kind=\"ReplicaSet\"},      \"replicaset\", \"$1\", \"owner_name\", \"(.*)\"    ) * on(replicaset, namespace) group_left(owner_name) topk by(replicaset, namespace) (      1, max by (replicaset, namespace, owner_name) (        kube_replicaset_owner{job=\"kube-state-metrics\"}      )    ),    \"workload\", \"$1\", \"owner_name\", \"(.*)\"  ))",
          "labels" : {
            "workload_type" : "deployment"
          }
        },
        {
          "record" : "namespace_workload_pod:kube_pod_owner:relabel",
          "expression" : "max by (cluster, namespace, workload, pod) (  label_replace(    kube_pod_owner{job=\"kube-state-metrics\", owner_kind=\"DaemonSet\"},    \"workload\", \"$1\", \"owner_name\", \"(.*)\"  ))",
          "labels" : {
            "workload_type" : "daemonset"
          }
        },
        {
          "record" : "namespace_workload_pod:kube_pod_owner:relabel",
          "expression" : "max by (cluster, namespace, workload, pod) (  label_replace(    kube_pod_owner{job=\"kube-state-metrics\", owner_kind=\"StatefulSet\"},    \"workload\", \"$1\", \"owner_name\", \"(.*)\"  ))",
          "labels" : {
            "workload_type" : "statefulset"
          }
        },
        {
          "record" : "namespace_workload_pod:kube_pod_owner:relabel",
          "expression" : "max by (cluster, namespace, workload, pod) (  label_replace(    kube_pod_owner{job=\"kube-state-metrics\", owner_kind=\"Job\"},    \"workload\", \"$1\", \"owner_name\", \"(.*)\"  ))",
          "labels" : {
            "workload_type" : "job"
          }
        },
        {
          "record" : ":node_memory_MemAvailable_bytes:sum",
          "expression" : "sum(  node_memory_MemAvailable_bytes{job=\"node\"} or  (    node_memory_Buffers_bytes{job=\"node\"} +    node_memory_Cached_bytes{job=\"node\"} +    node_memory_MemFree_bytes{job=\"node\"} +    node_memory_Slab_bytes{job=\"node\"}  )) by (cluster)"
        },
        {
          "record" : "cluster:node_cpu:ratio_rate5m",
          "expression" : "sum(rate(node_cpu_seconds_total{job=\"node\",mode!=\"idle\",mode!=\"iowait\",mode!=\"steal\"}[5m])) by (cluster) /count(sum(node_cpu_seconds_total{job=\"node\"}) by (cluster, instance, cpu)) by (cluster)"
        }
      ]
    }
  })

  schema_validation_enabled = false
  ignore_missing_property   = false
}

You can see some linking references in this code, particularly the azurerm_monitor_data_collection_rule_association that links to the AKS cluster id.

I deployed this set of code, and expected to see my Azure Monitor Workspace show a connection to the cluster within “Monitored Clusters”, but did not:

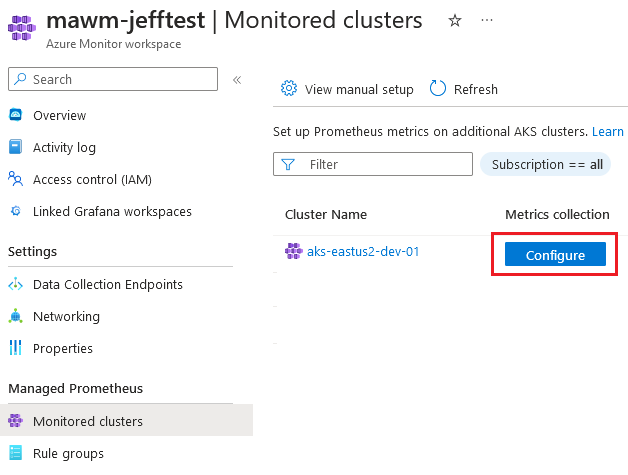
In addition, when evaluating the cluster I didn’t see any Daemonsets created for the ama-metrics-node that the Verify step in the documentation describes.

I pored over the example Terraform code to try and identify what I had missed, and after a while realized that my azurerm_kubernetes_cluster resource was actually different than the example. I was missing the following block, which the provider doc describes as “Specifies a Prometheus add-on profile for the Kubernetes Cluster”.

monitor_metrics {
  annotations_allowed = null
  labels_allowed      = null
}

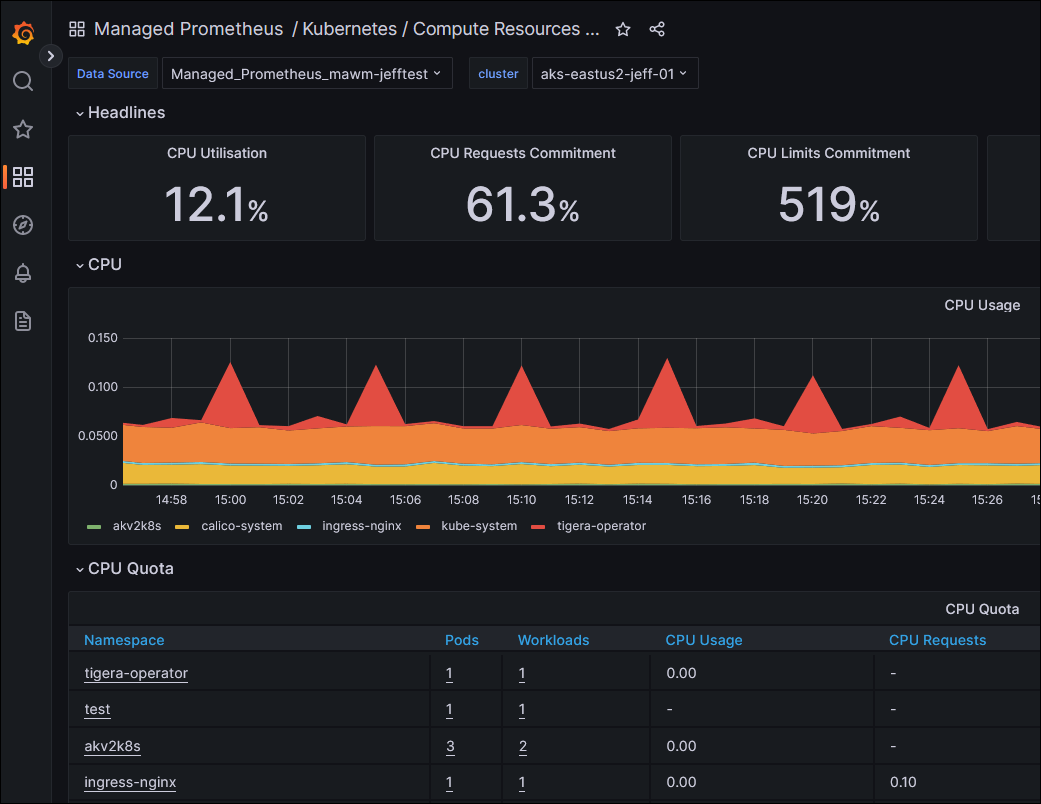
The example code supplies variables for these two attributes, but I set them to null for now. As soon as I ran a terraform apply my cluster was modified, the Metrics Agent components were deployed to my cluster, and my Grafana dashboards began to be populated.

I hit the Grafana url provided by my Terraform output, signed on as the user that I provided in the var.adminGroupObjectIds, and looked at the built-in Dashboards:


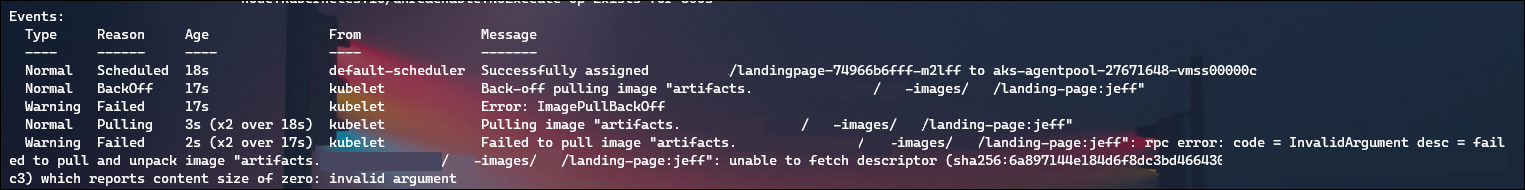
Next I looked to the Windows integration instructions (doc link). These consist of “download this yaml file, and apply it to your cluster with kubectl, which I have integrated into my Terraform deployment.

Step one – download the windows-exporter-daemonset.yaml file, and make some modifications because I’m running Windows Server 2022 nodes.

I changed line 24 to use the LTSC2022 image tag for the InitContainer: mcr.microsoft.com/windows/nanoserver:ltsc2022

I also changed line 31 for the same reason, to this tag: ghcr.io/prometheus-community/windows-exporter:latest-ltsc2022

Then I pulled the ConfigMap resource within that file (separated by the yaml document separator of ---) into it’s own file. This is so that I can use the kubectl_manifest resource from the gavinbunney/kubectl provider to perform the deployment; it doesn’t support multiple yaml documents within a single file. I’m using the kubectl provider for this manifest deployment because kubernetes_manifest has an issue with requiring cluster API availability during the plan, which doesn’t work when we haven’t deployed the cluster yet.

resource "kubectl_manifest" "windows-exporter-daemonset" {
  yaml_body = file("windows-exporter-daemonset_daemonset.yaml")
}

resource "kubectl_manifest" "windows-exporter-configmap" {
  yaml_body = file("windows-exporter-daemonset_configmap.yaml")
}

With the previous configuration of our kubectl provider in Part 1, this will ensure this Daemonset is deployed to our cluster.

The instructions state to “Apply the ama-metrics-settings-configmap to your cluster” as the next step. This is done in the same way – downloading locally, making the modifications as described (Set the windowsexporter and windowskubeproxy Booleans to true) and adding to our Terraform configuration in another kubernetes_manifest resource:

# Apply the ama-metrics-settings-configmap to your cluster.
resource "kubectl_manifest" "ama-metrics-settings-configmap" {
  yaml_body = file("ama-metrics-settings-configmap.yaml")
}

Finally, we need to enable the Prometheus recording rules for Windows nodes and cluster. The doc links to an ARM template, which I could have refactored into an AzApi resource like the Linux recording rules above. However, before I realized that was an option I had already formatted this resource into the Terraform syntax for a monitor_alert_prometheus_rule_group:

resource "azurerm_monitor_alert_prometheus_rule_group" "noderecordingrules" {
  # https://github.com/Azure/prometheus-collector/blob/kaveesh/windows_recording_rules/AddonArmTemplate/WindowsRecordingRuleGroupTemplate/WindowsRecordingRules.json
  name                = "NodeRecordingRulesRuleGroup-Win-${azurerm_kubernetes_cluster.default.name}"
  location            = azurerm_resource_group.default.location
  resource_group_name = azurerm_resource_group.default.name
  cluster_name        = azurerm_kubernetes_cluster.default.name
  description         = "Kubernetes Recording Rules RuleGroup for Win"
  rule_group_enabled  = true
  interval            = "PT1M"
  scopes              = [azurerm_monitor_workspace.default.id]

  rule {
    enabled    = true
    record     = "node:windows_node:sum"
    expression = <<EOF
count (windows_system_system_up_time{job="windows-exporter"})
EOF
  }
  rule {
    enabled    = true
    record     = "node:windows_node_num_cpu:sum"
    expression = <<EOF
count by (instance) (sum by (instance, core) (windows_cpu_time_total{job="windows-exporter"}))
EOF
  }
  rule {
    enabled    = true
    record     = ":windows_node_cpu_utilisation:avg5m"
    expression = <<EOF
1 - avg(rate(windows_cpu_time_total{job="windows-exporter",mode="idle"}[5m]))
EOF
  }
  rule {
    enabled    = true
    record     = "node:windows_node_cpu_utilisation:avg5m"
    expression = <<EOF
1 - avg by (instance) (rate(windows_cpu_time_total{job="windows-exporter",mode="idle"}[5m]))
EOF
  }
  rule {
    enabled    = true
    record     = ":windows_node_memory_utilisation:"
    expression = <<EOF
1 -sum(windows_memory_available_bytes{job="windows-exporter"})/sum(windows_os_visible_memory_bytes{job="windows-exporter"})
EOF
  }
  rule {
    enabled    = true
    record     = ":windows_node_memory_MemFreeCached_bytes:sum"
    expression = <<EOF
sum(windows_memory_available_bytes{job="windows-exporter"} + windows_memory_cache_bytes{job="windows-exporter"})
EOF
  }
  rule {
    enabled    = true
    record     = "node:windows_node_memory_totalCached_bytes:sum"
    expression = <<EOF
(windows_memory_cache_bytes{job="windows-exporter"} + windows_memory_modified_page_list_bytes{job="windows-exporter"} + windows_memory_standby_cache_core_bytes{job="windows-exporter"} + windows_memory_standby_cache_normal_priority_bytes{job="windows-exporter"} + windows_memory_standby_cache_reserve_bytes{job="windows-exporter"})
EOF
  }
  rule {
    enabled    = true
    record     = ":windows_node_memory_MemTotal_bytes:sum"
    expression = <<EOF
sum(windows_os_visible_memory_bytes{job="windows-exporter"})
EOF
  }
  rule {
    enabled    = true
    record     = "node:windows_node_memory_bytes_available:sum"
    expression = <<EOF
sum by (instance) ((windows_memory_available_bytes{job="windows-exporter"}))
EOF
  }
  rule {
    enabled    = true
    record     = "node:windows_node_memory_bytes_total:sum"
    expression = <<EOF
sum by (instance) (windows_os_visible_memory_bytes{job="windows-exporter"})
EOF
  }
  rule {
    enabled    = true
    record     = "node:windows_node_memory_utilisation:"
    expression = <<EOF
(node:windows_node_memory_bytes_total:sum - node:windows_node_memory_bytes_available:sum) / scalar(sum(node:windows_node_memory_bytes_total:sum))
EOF
  }
  rule {
    enabled    = true
    record     = "node:windows_node_memory_utilisation:"
    expression = <<EOF
1 - (node:windows_node_memory_bytes_available:sum / node:windows_node_memory_bytes_total:sum)
EOF
  }
  rule {
    enabled    = true
    record     = "node:windows_node_memory_swap_io_pages:irate"
    expression = <<EOF
irate(windows_memory_swap_page_operations_total{job="windows-exporter"}[5m])
EOF
  }
  rule {
    enabled    = true
    record     = ":windows_node_disk_utilisation:avg_irate"
    expression = <<EOF
avg(irate(windows_logical_disk_read_seconds_total{job="windows-exporter"}[5m]) + irate(windows_logical_disk_write_seconds_total{job="windows-exporter"}[5m]))
EOF
  }
  rule {
    enabled    = true
    record     = "node:windows_node_disk_utilisation:avg_irate"
    expression = <<EOF
avg by (instance) ((irate(windows_logical_disk_read_seconds_total{job="windows-exporter"}[5m]) + irate(windows_logical_disk_write_seconds_total{job="windows-exporter"}[5m])))
EOF
  }
}

resource "azurerm_monitor_alert_prometheus_rule_group" "nodeandkubernetesrules" {
  # https://github.com/Azure/prometheus-collector/blob/kaveesh/windows_recording_rules/AddonArmTemplate/WindowsRecordingRuleGroupTemplate/WindowsRecordingRules.json
  name                = "NodeAndKubernetesRecordingRulesRuleGroup-Win-${azurerm_kubernetes_cluster.default.name}"
  location            = azurerm_resource_group.default.location
  resource_group_name = azurerm_resource_group.default.name
  cluster_name        = azurerm_kubernetes_cluster.default.name
  description         = "Kubernetes Recording Rules RuleGroup for Win"
  rule_group_enabled  = true
  interval            = "PT1M"
  scopes              = [azurerm_monitor_workspace.default.id]

  rule {
    enabled    = true
    record     = "node:windows_node_filesystem_usage:"
    expression = <<EOF
max by (instance,volume)((windows_logical_disk_size_bytes{job="windows-exporter"} - windows_logical_disk_free_bytes{job="windows-exporter"}) / windows_logical_disk_size_bytes{job="windows-exporter"})
EOF
  }
  rule {
    enabled    = true
    record     = "node:windows_node_filesystem_avail:"
    expression = <<EOF
max by (instance, volume) (windows_logical_disk_free_bytes{job="windows-exporter"} / windows_logical_disk_size_bytes{job="windows-exporter"})
EOF
  }
  rule {
    enabled    = true
    record     = ":windows_node_net_utilisation:sum_irate"
    expression = <<EOF
sum(irate(windows_net_bytes_total{job="windows-exporter"}[5m]))
EOF
  }
  rule {
    enabled    = true
    record     = "node:windows_node_net_utilisation:sum_irate"
    expression = <<EOF
sum by (instance) ((irate(windows_net_bytes_total{job="windows-exporter"}[5m])))
EOF
  }
  rule {
    enabled    = true
    record     = ":windows_node_net_saturation:sum_irate"
    expression = <<EOF
sum(irate(windows_net_packets_received_discarded_total{job="windows-exporter"}[5m])) + sum(irate(windows_net_packets_outbound_discarded_total{job="windows-exporter"}[5m]))
EOF
  }
  rule {
    enabled    = true
    record     = "node:windows_node_net_saturation:sum_irate"
    expression = <<EOF
sum by (instance) ((irate(windows_net_packets_received_discarded_total{job="windows-exporter"}[5m]) + irate(windows_net_packets_outbound_discarded_total{job="windows-exporter"}[5m])))
EOF
  }
  rule {
    enabled    = true
    record     = "windows_pod_container_available"
    expression = <<EOF
windows_container_available{job="windows-exporter"} * on(container_id) group_left(container, pod, namespace) max(kube_pod_container_info{job="kube-state-metrics"}) by(container, container_id, pod, namespace)
EOF
  }
  rule {
    enabled    = true
    record     = "windows_container_total_runtime"
    expression = <<EOF
windows_container_cpu_usage_seconds_total{job="windows-exporter"} * on(container_id) group_left(container, pod, namespace) max(kube_pod_container_info{job="kube-state-metrics"}) by(container, container_id, pod, namespace)
EOF
  }
  rule {
    enabled    = true
    record     = "windows_container_memory_usage"
    expression = <<EOF
windows_container_memory_usage_commit_bytes{job="windows-exporter"} * on(container_id) group_left(container, pod, namespace) max(kube_pod_container_info{job="kube-state-metrics"}) by(container, container_id, pod, namespace)
EOF
  }
  rule {
    enabled    = true
    record     = "windows_container_private_working_set_usage"
    expression = <<EOF
windows_container_memory_usage_private_working_set_bytes{job="windows-exporter"} * on(container_id) group_left(container, pod, namespace) max(kube_pod_container_info{job="kube-state-metrics"}) by(container, container_id, pod, namespace)
EOF
  }
  rule {
    enabled    = true
    record     = "windows_container_network_received_bytes_total"
    expression = <<EOF
windows_container_network_receive_bytes_total{job="windows-exporter"} * on(container_id) group_left(container, pod, namespace) max(kube_pod_container_info{job="kube-state-metrics"}) by(container, container_id, pod, namespace)
EOF
  }
  rule {
    enabled    = true
    record     = "windows_container_network_transmitted_bytes_total"
    expression = <<EOF
windows_container_network_transmit_bytes_total{job="windows-exporter"} * on(container_id) group_left(container, pod, namespace) max(kube_pod_container_info{job="kube-state-metrics"}) by(container, container_id, pod, namespace)
EOF
  }
  rule {
    enabled    = true
    record     = "kube_pod_windows_container_resource_memory_request"
    expression = <<EOF
max by (namespace, pod, container) (kube_pod_container_resource_requests{resource="memory",job="kube-state-metrics"}) * on(container,pod,namespace) (windows_pod_container_available)
EOF
  }
  rule {
    enabled    = true
    record     = "kube_pod_windows_container_resource_memory_limit"
    expression = <<EOF
kube_pod_container_resource_limits{resource="memory",job="kube-state-metrics"} * on(container,pod,namespace) (windows_pod_container_available)
EOF
  }
  rule {
    enabled    = true
    record     = "kube_pod_windows_container_resource_cpu_cores_request"
    expression = <<EOF
max by (namespace, pod, container) ( kube_pod_container_resource_requests{resource="cpu",job="kube-state-metrics"}) * on(container,pod,namespace) (windows_pod_container_available)
EOF
  }
  rule {
    enabled    = true
    record     = "kube_pod_windows_container_resource_cpu_cores_limit"
    expression = <<EOF
kube_pod_container_resource_limits{resource="cpu",job="kube-state-metrics"} * on(container,pod,namespace) (windows_pod_container_available)
EOF
  }
  rule {
    enabled    = true
    record     = "namespace_pod_container:windows_container_cpu_usage_seconds_total:sum_rate"
    expression = <<EOF
sum by (namespace, pod, container) (rate(windows_container_total_runtime{}[5m]))
EOF
  }
}

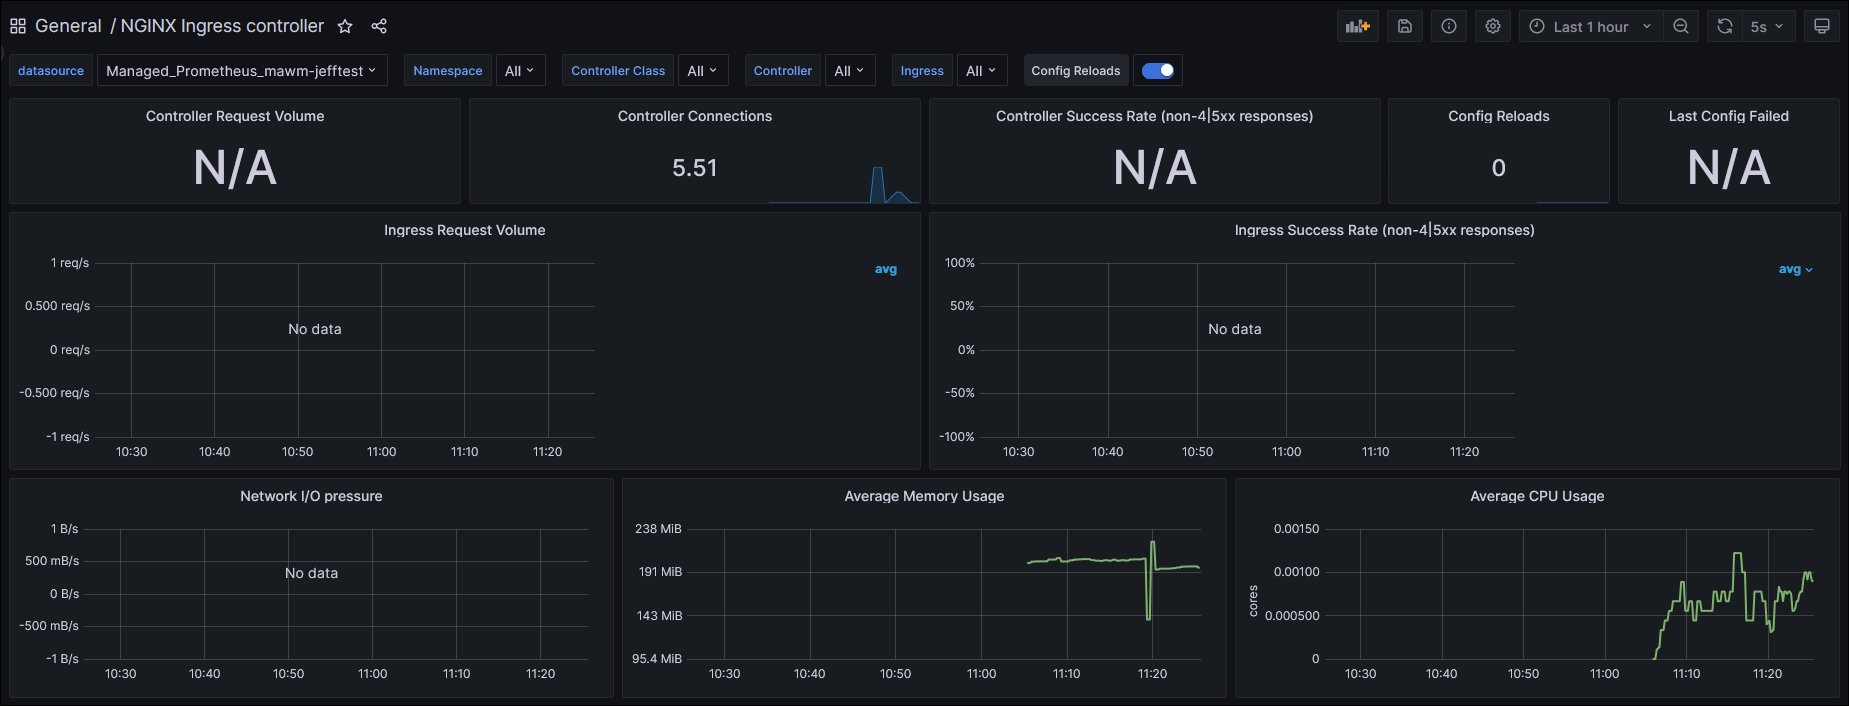
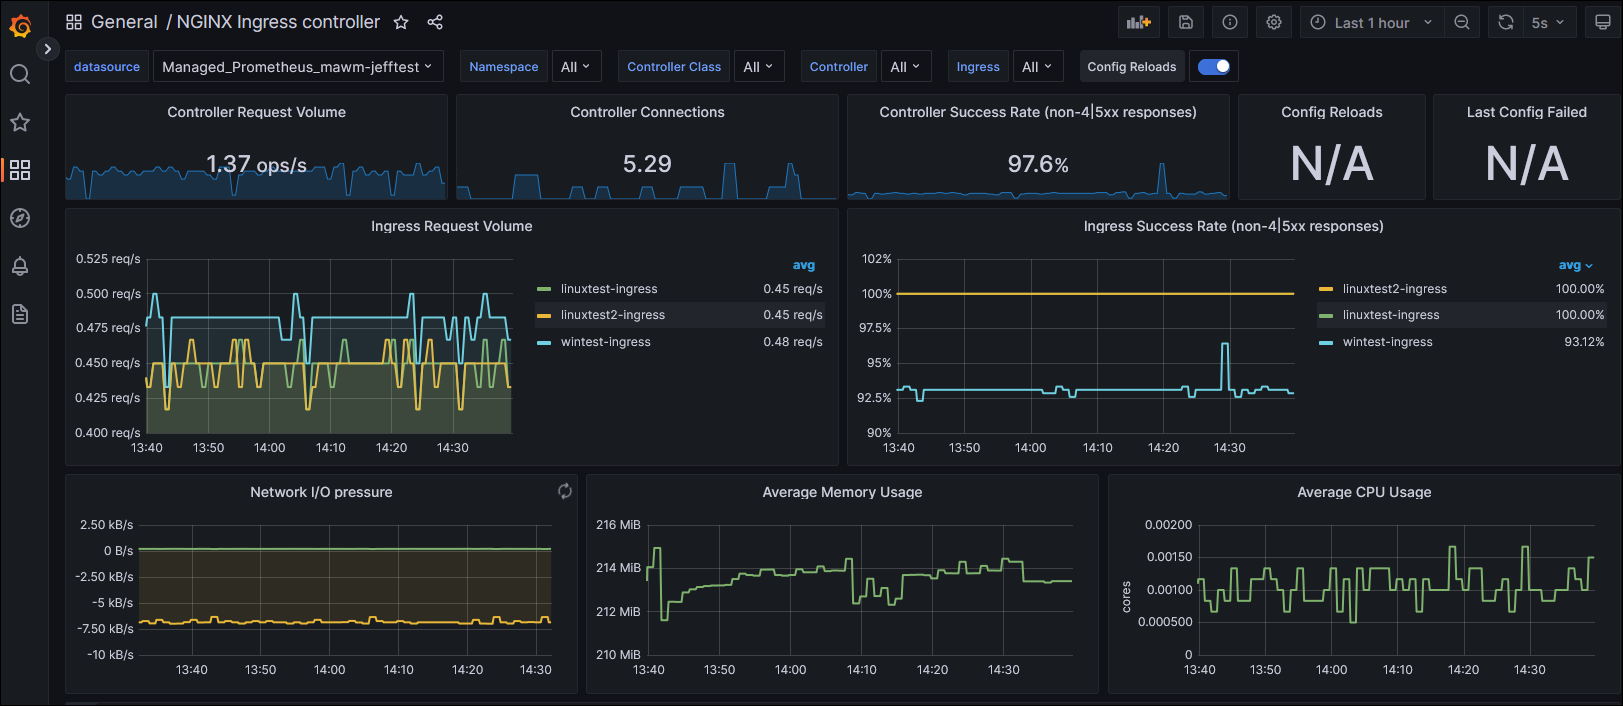
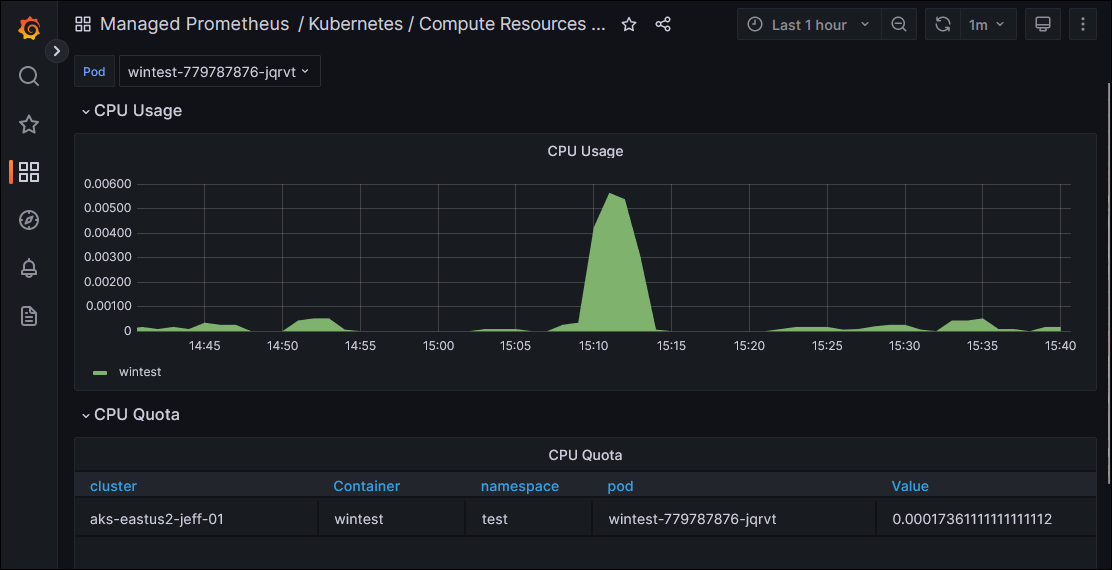
This worked! After deploying these changes, when I inspected the Windows-specific Dashboards in Grafana, I began to see data for my Windows workload that I had deployed:


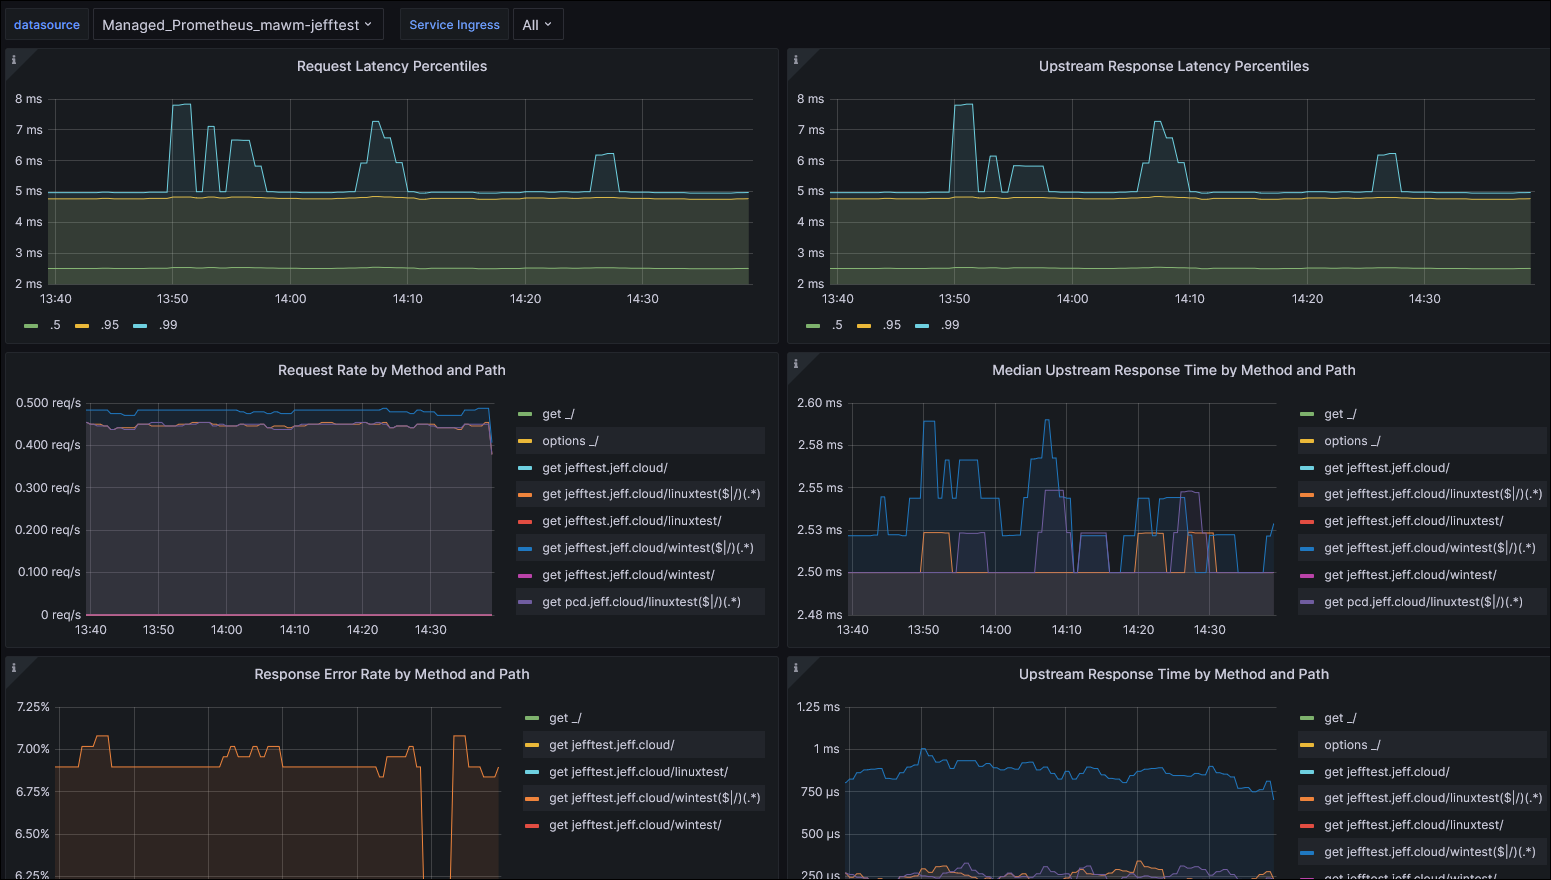
My next goal is to get metrics out of ingress-nginx, which has support for Prometheus metrics. I want to have an easy way to see traffic reaching certain ingress paths without having to instrument each application behind it, so this is a key functionality of my monitoring solution. I’ll look at that more closely in Part 3 of this blog series.


Azure Managed Prometheus and Grafana with Terraform – part 1

I’m learning about monitoring solutions for an Azure Kubernetes Service (AKS), and have been experimenting with Azure Managed Prometheus and Azure Managed Grafana. This is a multi-part blog series due to the length of content:

The Prometheus and Grafana stack is very common for Kubernetes environments, but the idea of not having to maintain the health of those systems is very attractive to me. When I picture integrating these solutions into the platform I’m building, the less complexity I add for my team the easier it is to support the platform.

There are a few key limitations unfortunately that might delay my usage of these solutions:

  • Azure Managed Prometheus isn’t currently available in the Azure US Government cloud (link). Expected Q2 2023 ()
  • Only support for K8s resources, not ingest from standalone VMs and other sources (link). This may be mitigated with extra self-managed Prometheus and Remote-write capabilities
  • Role Based Access Control within Managed Grafana isn’t available

One of my key considerations as I evaluated these managed services is how repeatable is implementation through code – I need to be able to reproduce environments on-demand and not depend on written procedures of manual intervention in Portal interfaces.

This Part 1 of the series will cover an initial setup of an environment to facilitate the proof of concept. I’m using Terraform as my deployment tool, running interactively against a local state file for convenience. Relying upon the Terraform providers for AzureRM, Kubernetes, and Helm, I am able to repeatably deploy this solution.

I will say that the methods I use in the following code are only suitable for proof-of-concept environments; there are much better ways to handle secret management and authentication for these providers when targeting a production system; this may include wrapper scripts to pull secrets interactively from a KeyVault, or using Azure Managed Identities for virtual machine resources and ensure Terraform runs from within that resource.

The source code for this part 1 post can be found here in my GitHub repo: aks-prometheus-grafana (part 1)

There are some opinionated resources and structures in what I’m configuring, based on ease-of-use, supporting systems, and integration in the broader platform that I’m building. These will be described throughout this post, and can be easily stripped out if they are unnecessary in other environments.

We begin by specifying required_providers, including the fully qualified address, as this is Terraform best practice (link). Normally I would also include version pinning on these providers in my root module.

terraform {
  # ---------------------------------------------------
  # Setup providers
  # ---------------------------------------------------
  required_providers {
    azurerm = {
      source  = "registry.terraform.io/hashicorp/azurerm"
    }
    kubernetes = {
      source  = "registry.terraform.io/hashicorp/kubernetes"
    }
    # Used to deploy kubectl_manifest resource
    kubectl = {
      source  = "gavinbunney/kubectl"
    }
    helm = {
      source  = "registry.terraform.io/hashicorp/helm"
    }
    random = {
      source  = "registry.terraform.io/hashicorp/random"
    }
  }
}

Next we’ll specify the Provider Configuration for each:

provider "azurerm" {
  features {}
  environment = "public"
}
provider "kubernetes" {
  host                   = azurerm_kubernetes_cluster.default.kube_admin_config.0.host
  username               = azurerm_kubernetes_cluster.default.kube_admin_config.0.username
  password               = azurerm_kubernetes_cluster.default.kube_admin_config.0.password
  client_certificate     = base64decode(azurerm_kubernetes_cluster.default.kube_admin_config.0.client_certificate)
  client_key             = base64decode(azurerm_kubernetes_cluster.default.kube_admin_config.0.client_key)
  cluster_ca_certificate = base64decode(azurerm_kubernetes_cluster.default.kube_admin_config.0.cluster_ca_certificate)
}
provider "kubectl" {
  host                   = azurerm_kubernetes_cluster.default.kube_admin_config.0.host
  username               = azurerm_kubernetes_cluster.default.kube_admin_config.0.username
  password               = azurerm_kubernetes_cluster.default.kube_admin_config.0.password
  client_certificate     = base64decode(azurerm_kubernetes_cluster.default.kube_admin_config.0.client_certificate)
  client_key             = base64decode(azurerm_kubernetes_cluster.default.kube_admin_config.0.client_key)
  cluster_ca_certificate = base64decode(azurerm_kubernetes_cluster.default.kube_admin_config.0.cluster_ca_certificate)
}
provider "helm" {
  kubernetes {
    host                   = azurerm_kubernetes_cluster.default.kube_admin_config.0.host
    username               = azurerm_kubernetes_cluster.default.kube_admin_config.0.username
    password               = azurerm_kubernetes_cluster.default.kube_admin_config.0.password
    client_certificate     = base64decode(azurerm_kubernetes_cluster.default.kube_admin_config.0.client_certificate)
    client_key             = base64decode(azurerm_kubernetes_cluster.default.kube_admin_config.0.client_key)
    cluster_ca_certificate = base64decode(azurerm_kubernetes_cluster.default.kube_admin_config.0.cluster_ca_certificate)
  }
  registry {
    # Manually perform a `helm repo update` on the runner before running Terraform
    url      = "oci://artifacts.private.registry"
    username = "api"
    # Pass in secret on environment variable named TF_VAR_artifactAPIToken
    password = var.artifactAPIToken
  }
}

Some key things to note from that code block above:

  • I’m using the defaults of the AzureRM provider to rely upon my authenticated session with Azure CLI – including the definition of an Azure Subscription to target.
  • The Kubernetes and Helm provider configurations are dependent on an “azurerm_kubernetes_cluster” resource that has yet to be defined in my configuration. This is a common (but not great way) to authenticate. A better choice would be to securely build a Kubeconfig on the worker that is to run Terraform, and reference that with the “config_path” attribute instead
  • I’m using a private registry for my Helm charts, where my organization has control over versions, content, and security scanning. This is authenticated using an API token that only contains read access, which I am passing in as an OS environment variable in the supported Terraform format.

Let’s create a few initial resources now:

variable "adminGroupObjectIds" {
  type        = list(string)
  description = "A list of Object IDs of Azure Active Directory Groups which should have Admin Role on the Cluster"
  default     = []
}
variable "artifactAPIToken" {
  type        = string
  description = "String containing API token for private artifact registry"
}
## ---------------------------------------------------
# Initial resource group
## ---------------------------------------------------
# Utilize the current Azure CLI context as a data source for future reference
data "azurerm_client_config" "current" {}

resource "azurerm_resource_group" "default" {
  name     = "rg-test"
  location = "eastus2"
}

## ---------------------------------------------------
# user name and password setup for AKS node pools
## ---------------------------------------------------
resource "random_string" "userName" {
  length  = 8
  special = false
  upper   = false
}
resource "random_password" "userPasswd" {
  length           = 32
  special          = true
  override_special = "!#$%&amp;*()-_=+[]{}&lt;&gt;:?"
}

## ---------------------------------------------------
# Azure KeyVault and components
## ---------------------------------------------------
resource "azurerm_key_vault" "default" {
  name                            = "kv-aks1234" # Must resolve to 24 characters or less
  resource_group_name             = azurerm_resource_group.default.name
  location                        = azurerm_resource_group.default.location
  tenant_id                       = data.azurerm_client_config.current.tenant_id
  soft_delete_retention_days      = 7
  enabled_for_deployment          = true
  enabled_for_template_deployment = true
  sku_name                        = "standard"
}
# Store the generated username/password in the KeyVault
resource "azurerm_key_vault_secret" "node_admin_name" {
  name         = "aksadminname"
  value        = random_string.userName.result
  key_vault_id = azurerm_key_vault.default.id
}

resource "azurerm_key_vault_secret" "node_admin_passwd" {
  name         = "aksadminpasswd"
  value        = random_password.userPasswd.result
  key_vault_id = azurerm_key_vault.default.id
}

This config provides the capability to access the randomly generated username/password for the AKS nodes if required for troubleshooting without having to inspect the Terraform state file to get their values. Note, the KeyVault name must be globally unique.

Time to create the AKS cluster itself, including a Windows node pool because that is part of my environment:

resource "azurerm_kubernetes_cluster" "default" {
  name                          = "aks-eastus2-test"
  resource_group_name           = azurerm_resource_group.default.name
  location                      = azurerm_resource_group.default.location
  dns_prefix                    = azurerm_resource_group.default.name
  node_resource_group           = "rg-aks-eastus2-test_node"
  public_network_access_enabled = true

  azure_active_directory_role_based_access_control {
    managed                = true
    azure_rbac_enabled     = true
    # Grant Cluster Admin to AzureAD object ids supplied at runtime
    admin_group_object_ids = var.adminGroupObjectIds
  }

  key_vault_secrets_provider {
    secret_rotation_enabled  = true
    secret_rotation_interval = "2m"
  }
  network_profile {
    network_plugin = "azure"
    network_mode   = "transparent"
    network_policy = "calico"
  }

  default_node_pool {
    name       = "system"
    node_count = 1
    vm_size    = "Standard_B2ms"
    os_sku     = "Mariner"
  }

  windows_profile {
    admin_username = random_string.userName.result
    admin_password = random_password.userPasswd.result
  }

  identity {
    type = "SystemAssigned"
  }
}

resource "azurerm_kubernetes_cluster_node_pool" "default" {
  name                  = "win22"
  kubernetes_cluster_id = azurerm_kubernetes_cluster.default.id
  mode                  = "User" # Node Pool Type
  enable_node_public_ip = false
  enable_auto_scaling   = true
  node_count            = 1
  min_count             = 1
  max_count             = 5
  max_pods              = 10
  vm_size               = "Standard_B2ms"
  os_type               = "Windows"
  os_sku                = "Windows2022"
}

This config creates a cluster with Azure RBAC for Kubernetes enabled (the azure_active_directory_role_based_access_control block), integration with the CSI Secrets Store Driver for KeyVault integration (the key_vault_secrets_provider block) and a System-Assigned Managed Identity (the identity block).
Now a few final components in preparation of the cluster:

resource "azurerm_role_assignment" "clusteradmin-rbacclusteradmin" {
  scope                = azurerm_kubernetes_cluster.default.id
  role_definition_name = "Azure Kubernetes Service RBAC Cluster Admin"
  principal_id         = var.adminGroupObjectIds[0]
}
## ---------------------------------------------------
# Keyvault access policy for secrets providers
## ---------------------------------------------------
resource "azurerm_key_vault_access_policy" "akvp" {
  key_vault_id = azurerm_key_vault.default.id
  tenant_id    = data.azurerm_client_config.current.tenant_id
  object_id    = azurerm_kubernetes_cluster.default.key_vault_secrets_provider.0.secret_identity.0.object_id
  secret_permissions = [
    "Get"
  ]
}
resource "azurerm_key_vault_access_policy" "akv2k8s" {
  key_vault_id = azurerm_key_vault.default.id
  tenant_id    = data.azurerm_client_config.current.tenant_id
  object_id    = azurerm_kubernetes_cluster.default.kubelet_identity[0].object_id
  secret_permissions = [
    "Get"
  ]
}

We create a role assignment within the Cluster (as part of the Azure RBAC for Kubernetes) based on a user/group object id, and then 2 KeyVault access policies.

The first is for the Azure KeyVault integration using the managed identity that is created when enabling the csi-secrets-store-driver.

The second is created for the managed identity assigned to the Linux nodes which will be used by the Akv2K8s project when installed. In my environment I am using the native Azure KeyVault integration for Windows pods, but the Akv2k8s solution for Linux pods because it offers enhanced security by injecting secrets from a KeyVault into an environment variable only accessible by the running process of the pod itself. This is greater protection than storing the secret as a K8s secret which is retrievable inside the cluster with enough permissions.

Next I’m going to perform Helm installations of a couple charts to assist in making workloads run-able:

## ---------------------------------------------------
# Helm Install
## ---------------------------------------------------
resource "helm_release" "akv2k8s" {
  name              = "akv2k8s"
  chart             = "third-party-helm/akv2k8s"
  namespace         = "akv2k8s"
  version           = "2.3.2"
  create_namespace  = true
  dependency_update = true
  set {
    name  = "controller.nodeSelector.kubernetes\\.io/os"
    value = "linux"
  }
  set {
    name  = "env_injector.nodeSelector.kubernetes\\.io/os"
    value = "linux"
  }
  set {
    name  = "global.metrics.enabled"
    value = "true"
  }
}

resource "helm_release" "ingress-nginx" {
  name              = "ingress-nginx"
  chart             = "third-party-helm/ingress-nginx"
  namespace         = "ingress-nginx"
  version           = "4.7.0"
  create_namespace  = true
  dependency_update = true
  set {
    name  = "controller.nodeSelector.kubernetes\\.io/os"
    value = "linux"
  }
  set {
    name  = "controller.service.annotations.service\\.beta\\.kubernetes\\.io/azure-load-balancer-health-probe-request-path"
    value = "/healthz"
  }
  set {
    name  = "metrics.enabled"
    value = "true"
  }
  set {
    name  = "controller.podAnnotations.prometheus\\.io/scrape"
    value = "true"
  }
  #set {
  #  name  = "controller.podAnnotations.prometheus\\.io/port"
  #  value = "10254"
  #}
}

Because I only have one Helm provider registered with a registry block, these chart sources are pulling through a feed on my private registry.

Since I have both Windows and Linux node pools, I need to set the nodeSelector attributes properly otherwise a Linux container will attempt and fail to run on a Windows node. I’m using the azure-load-balancer-health-probe-request-path annotation on ingress-nginx based on the examples provided in Microsoft Docs.

Finally we want to deploy a Windows workload into the cluster for testing and evaluation:

## ---------------------------------------------------
# Sample workload installation
## ---------------------------------------------------
resource "kubernetes_namespace" "test" {
  metadata {
    name = "test"
    labels = {
      # Used for akv2k8s integration
      "azure-key-vault-env-injection" = "enabled"
    }
  }
}
resource "kubernetes_deployment_v1" "wintest" {
  metadata {
    namespace = "test"
    name      = "wintest"
    labels = {
      test = "wintest"
    }
  }
  spec {
    replicas = 1
    selector {
      match_labels = {
        test = "wintest"
      }
    }
    template {
      metadata {
        labels = {
          test = "wintest"
        }
      }
      spec {
        container {
          image = "mcr.microsoft.com/windows/servercore/iis:windowsservercore-ltsc2022"
          name  = "wintest"
        }
      }
    }
  }
}
resource "kubernetes_service_v1" "wintest" {
  metadata {
    namespace = "test"
    name      = "wintest-svc"
  }
  spec {
    selector = {
      test = "wintest"
    }
    port {
      port        = 80
      target_port = 80
    }
  }
}

resource "kubernetes_ingress_v1" "wintest" {
  metadata {
    namespace = "test"
    name      = "wintest-ingress"
  }
  spec {
    ingress_class_name = "nginx"
    rule {
      http {
        path {
          path = "/"
          backend {
            service {
              name = "wintest-svc"
              port {
                number = 80
              }
            }
          }
        }
      }
    }
  }
}

This produces a Deployment of a Windows Server 2022 IIS container, a Service, and in Ingress tied to the ingress-nginx controller that was created through Helm.

I can connect to my AKS cluster with Azure CLI, kubectl describe my Ingress to view it’s public IP address:

And then hit it in the browser on the “iisstart.htm” page to valid it is working:

Now we’re all set to begin working with the managed services of Prometheus and Grafana, which I’ll dig into in part 2.

AKS image pull failed from ProGet

July 2022 Update

After a support case with Inedo and Microsoft, this has been determined to be caused by Azure AD Application Proxy setting the Content-Length attribute to 0 for every HEAD request.

Microsoft is aware of this and has it in their backlog, along with a corresponding feedback item:

https://feedback.azure.com/d365community/idea/43a1e16f-bffe-ec11-a81b-6045bd853c94

Original Post

Just solved (kind of) an issue with Azure Kubernetes Service performing an Image Pull from a private container registry provided by Inedo ProGet.

Using AKS 1.22.4 with containderd 1.55, I’ve followed the K8s instructions to pull an image from a private registry with the creation of a secret which is then referenced in the yaml manifest.

However, when I apply the manifest, my Pod doesn’t start, ending with an ErrImagePull error.

Performing a “kubectl describe pod [podname]” shows this error:

Failed to pull image "source repo/imagename:tag": rpc error: code = InvalidArgument desc = failed to pull and unpack image "source repo/imagename:tag": unable to fetch descriptor (sha256:hash) which reports content size of zero: invalid argument

Not a lot of other insights online related to this message, but I CAN see that it comes directly from containerd source code here: containerd/handlers.go at main · containerd/containerd · GitHub

I did find one reference talking about this error and an “Azure proxy”, and my ProGet instance was exposed to the Internet over Azure AD Application Proxy. Even though I could successfully reference and pull other container images from my ProGet instance, I modified my connectivity to be direct through my firewall temporarily – this didn’t resolve the problem.

I spent a little bit of time making sure my K8s “imagePullSecrets” was correct – again was able to verify successful pull from ProGet.

On a test machine, I also verified I could perform a ‘docker login’ command against ProGet and a ‘docker pull’, which was successful with this troublesome image.

I used ‘docker image inspect [image name]’ to compare against my working image and broken image, but didn’t find anything conclusive.

I knew this SAME image worked from Azure Container Registry (ACR), so I performed some docker tag and push commands to get the image into my ProGet:

docker tag myrepo.azurecr.io/path/landingpage:tag privaterepo.domain.com/path/landing-page:tag
docker push privaterepo.domain.com/path/landing-page:tag

My thought was, “same image, should work!” but I still received the same problem.


Wanting to look a little deeper, I tried to learn how to see a bit more interaction when my AKS cluster was attempting the image pull. This is when I came across Debugging K8s Nodes with crictl.

Using the knowledge of this tool, as well as Microsoft Docs on Connecting to AKS nodes, I was able to establish a privileged container and gain access to commands against my node with “chroot /host”.

I hit a roadblock trying to use crictl help docs to pull an image, as it continuously gave me a 403 Forbidden error despite proper credentials. But then I learned about “ctr”, which I discovered was already usable on my nodes from my privileged container!

Now we’re in business – the command “ctr image pull” has a flag for –http-dump which gave me a lot more information

I performed image pulls for my working image and broken image, and noticed the broken one was a LOT more chatty – multiple HTTP requests that seemed to be repeating.

Here’s the requests made for the working image:

  1. HEAD /v2/[image path]/[image name]/manifests/[tag]
  2. POST /v2/_auth
  3. GET /v2/_auth?scope=repository%3A[image path]%2F[image name]%3Apull&service=[repo name]
  4. HEAD /v2/[image path]/[image name]/manifests/[tag]

And this is what I saw for the broken image:

  1. HEAD /v2/[image path]/[image name]/manifests/[tag]
  2. POST /v2/_auth
  3. GET /v2/_auth?scope=repository%3A[image path]%2F[image name]%3Apull&service=[repo name]
  4. GET /v2/[image path]/[image name]/manifests/sha256:[hash]
  5. POST /v2/_auth
  6. GET /v2/_auth?scope=repository%3A[image path]%2F[image name]%3Apull&service=[repo name]
  7. GET /v2/[image path]/[image name]/manifests/sha256:[hash]
  8. GET /v2/[image path]/[image name]/blobs/sha256:[hash]
Quite a bit different, and some of the output from request #7 caught my eye – the response contained this header:
INFO[0001] Content-Type: application/vnd.docker.distribution.manifest.v2+json

And this content (truncated):

INFO[0001] "schemaVersion": 2,
INFO[0001] "mediaType": "application/vnd.docker.distribution.manifest.v2+json",
INFO[0001] "config": {
INFO[0001]     "mediaType": "application/vnd.docker.container.image.v1+json",
INFO[0001]     "digest": "sha256:hash1"
INFO[0001] },
INFO[0001] "layers": [
INFO[0001] {
INFO[0001]    "mediaType": "application/vnd.docker.image.rootfs.diff.tar.gzip",
INFO[0001]    "size": 2814559,
INFO[0001]    "digest": "sha256:hash2"
INFO[0001] },
INFO[0001] {
INFO[0001]    "mediaType": "application/vnd.docker.image.rootfs.diff.tar.gzip",
INFO[0001]    "size": 7341522,
INFO[0001]    "digest": "sha256:hash3"
INFO[0001] },

I had seen this output before, in the metadata information provided by both ProGet, and ACR, so I did a comparison of my broken image between ProGet and ACR, and also my working image in ProGet.

What I found different in my broken image in ProGet was the “Size” attribute missing within the config property of the docker manifest!

ACR:

{
  "schemaVersion": 2,
  "mediaType": "application/vnd.docker.distribution.manifest.v2+json",
  "config": {
    "mediaType": "application/vnd.docker.container.image.v1+json",
    "size": 8486,
    "digest": "sha256:hash"
  },
}


ProGet:

{
  "schemaVersion": 2,
  "mediaType": "application/vnd.docker.distribution.manifest.v2+json",
  "config": {
    "mediaType": "application/vnd.docker.container.image.v1+json",
    "digest": "sha256:samehash"
  },
}

Even though I simply re-tagged the ACR image and pushed it into ProGet, that somehow dropped this size attribute.

I thought a short term fix would be to manually edit the docker manifest in ProGet to add the size property, but after finding and modifying the file (D:\ProGet\Packages\.docker\F7\manifests\sha256) it hadn’t updated in the ProGet GUI and I didn’t dig into that further.

Instead I re-checked my tests from the docker CLI, with “docker manifest inspect [image name]:[tag]”. What I found was that the ACR image had the size attribute, but somehow the image I re-tagged and pushed to ProGet did not!

So I re-tagged my ACR image again (call it “jeff2”), and then re-pushed to ProGet; this time, the size attribute stayed! I was then able to successfully perform a ‘ctr image pull’ command, and my ‘kubectl apply’ worked!

Here’s what I think happened:

  • First image push (done by teammate) to ProGet occurred over the Internet, behind the Azure AD App Proxy, which stripped the size attribute from the docker manifest
    • Perhaps similar in a way to this bug worked on by the wikimedia team with their varnish proxy?
  • Initial testing, including docker CLI re-tag and push done when ProGet was still behind the Azure AD App Proxy
  • Assume docker client doesn’t care about missing size attribute, but containerd does
  • Assume actual containerd image pull doesn’t mind coming from Azure AD App Proxy (why my other images worked from ProGet originally)
  • After switching to direct HTTPS, pushing an image to ProGet retains the size attribute.

One final test to explain my re-tagging behavior. I re-instated ProGet behind the Azure AD App Proxy, and then re-pushed my “jeff2” tagged image (not a pull from ProGet, just a push) and in both my workstation, and in ProGet, the size attribute was gone!

  • This confirms my assumption that re-tagging and pushing to ProGet not only dropped the attribute in ProGet, but my local docker image cache too.


For now, takeaway is don’t put ProGet behind Azure AD App Proxy! I’ve got a support case open with Inedo that I’ll relay this information to.

Populate Azure File Share from DevOps Pipeline

Use case: There’s a set of files/scripts/templates that I want to keep in sync on a set of servers, but only on-demand.

A few different ways to solve this, but one way following a pattern I’ve used a few times is to have an Azure DevOps pipeline that populates and Azure File Share, and then a separate script deployed on the servers that can on-demand pull in files from the File Share.

The script below is a YAML pipeline for Azure DevOps, that uses an AzurePowerShell task.

The primary issue I had to work-around with this (at least using the Azure PowerShell module, is that the cmdlet “Set-AzStorageFileContent” requires the parent directory to exist; it won’t auto-create it. And unfortunately “New-AzStorageDirectory” has the same problem, not creating directories recursively.

So the PowerShell script below has two sections: first to create all the folders by ensuring each leaf in the path of each distinct folder gets created, and then populating with files.


variables:
  storageAccountName: "stg123"
  resourcegroupName: "teststorage-rg"
  fileShareName: "firstfileshare"

trigger:
  branches:
    include:
    - main
  paths:
    include: # Only trigger the pipeline on this path in the git repo
    - 'FileTemplates/*'

pool:
    vmImage: 'windows-latest'
steps:

- task: AzurePowerShell@5
  inputs:
    azureSubscription: 'AzureSubConnection' #This is the devops service connection name
    ErrorActionPreference: 'Stop'
    FailOnStandardError: true
    ScriptType: 'inlineScript'
    inline: |
      $accountKey = (Get-AzStorageAccountKey -ResourceGroupName $(resourcegroupName) -Name $(storageAccountName))[0].Value
      $ctx = New-AzStorageContext -StorageAccountName $(StorageAccountName) -StorageAccountKey $accountKey
      $s = Get-AzStorageShare $(fileShareName) -Context $ctx
      # We only want to copy a subset of files in the repo, so we'll set our script location to that path
      Set-Location "$(Build.SourcesDirectory)\FileTemplates"
      $CurrentFolder = (Get-Item .).FullName
      $files = Get-ChildItem -Recurse | Where-Object { $_.GetType().Name -eq "FileInfo"}

      # Get all the unique folders without filenames
      $folders = $files.FullName.Substring($Currentfolder.Length+1).Replace("\","/") | split-path -parent | Get-Unique

      # Create Folders for every possible path
      foreach ($folder in $folders) {
        if ($folder -ne ""){
          $folderpath = ("dbscripts\" + $folder).Replace("\","/") # Create a toplevel folder in front of each path to organize within the Azure Share
          $foldersPathLeafs = $folderpath.Split("/")
          if ($foldersPathLeafs.Count -gt 1) {
            foreach ($index in 0..($foldersPathLeafs.Count - 1)) {
              $desiredfolderpath = [string]::Join("/", $foldersPathLeafs[0..$index])
              try {
                $s.ShareClient.GetDirectoryClient("$desiredfolderpath").CreateIfNotExists()
              }
              catch {
                $message = $_
                Write-Warning "That didn't work: $message"
              }

            }
          }
        }
      }

      # Create each file
      foreach ($file in $files) {
        $path=$file.FullName.Substring($Currentfolder.Length+1).Replace("\","/")
        $path = "scripts/"+$path # Create a toplevel folder in front of each path to organize within the Azure Share
        Write-output "Writing: $($file.FullName)"
        try {
          Set-AzStorageFileContent -Share $s.CloudFileShare -Source $file.FullName -Path $path -Force
        }
        catch {
          $message = $_
          Write-Warning "That didn't work: $message"
        }
      }
    azurePowerShellVersion: 'LatestVersion'
  displayName: "Azure Files Storage Copy"