Azure Managed Prometheus and Grafana with Terraform – part 3

This is part 3 in learning about monitoring solutions for an Azure Kubernetes Service (AKS), using Azure Managed Prometheus and Azure Managed Grafana.

In this post we are going to use Terraform to finish the implementation of gathering Prometheus metrics for the ingress-nginx controller, which will grant an application-centric view of metrics.

The source code for this part 3 post can be found here in my GitHub repo: aks-prometheus-grafana (part 3)

My criteria for success was to have a populated dashboard in Grafana for ingress-nginx metrics. The source code for ingress-nginx has two different dashboards that can be imported into Grafana: https://github.com/kubernetes/ingress-nginx/tree/main/deploy/grafana/dashboards

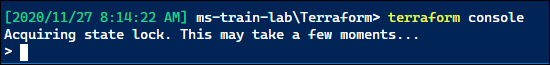
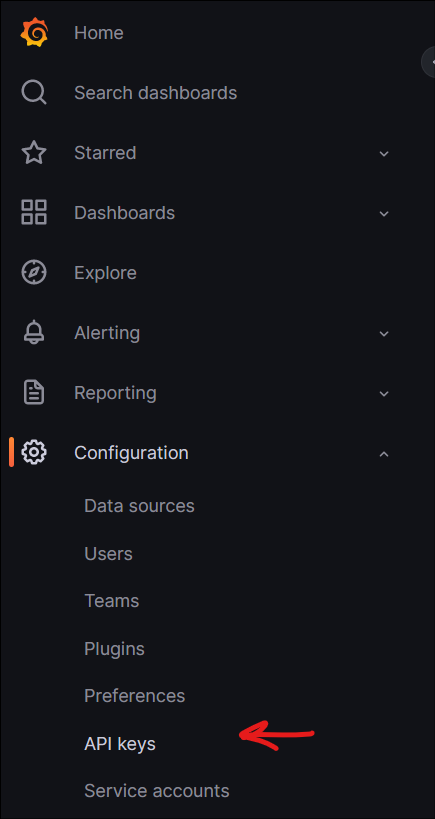
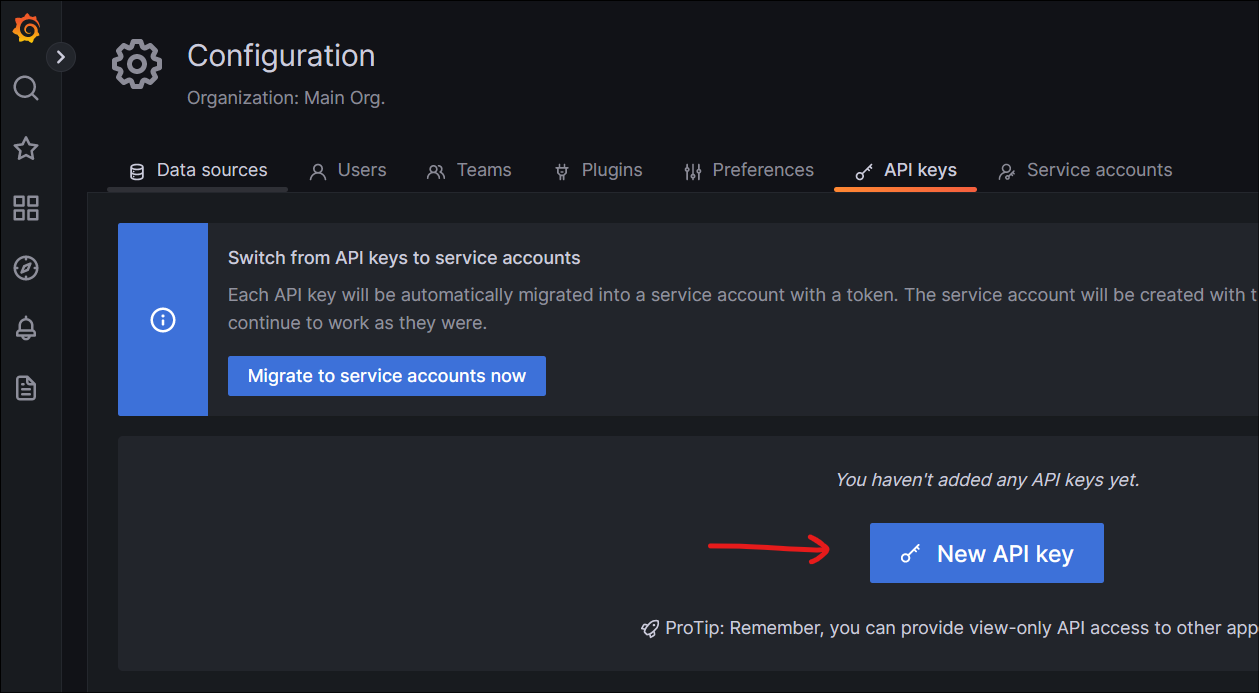
Now having access to Azure Managed Grafana, I used the web portal to create an API token that I could pass to Terraform.

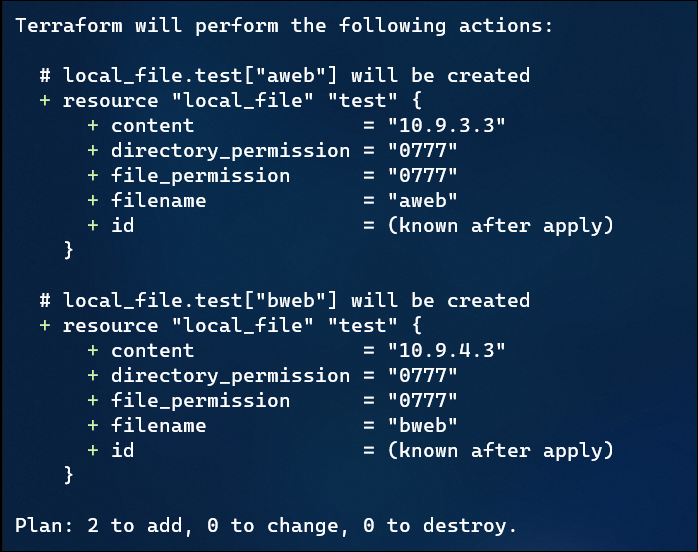
Within my Terraform config, I defined a Grafana provider, and then downloaded the JSON files for the dashboards and referenced them as a dashboard resource:

## ---------------------------------------------------
# Grafana Dashboards
## ---------------------------------------------------
provider "grafana" {
  url  = azurerm_dashboard_grafana.default.endpoint
  auth = "securely pass api token"
}
resource "grafana_dashboard" "nginxmetrics" {
  depends_on = [ azurerm_dashboard_grafana.default ]
  config_json = file("nginx.json")
}
resource "grafana_dashboard" "requestHandlingPerformance" {
  depends_on = [ azurerm_dashboard_grafana.default ]
  config_json = file("requestHandlingPerformance.json")
}

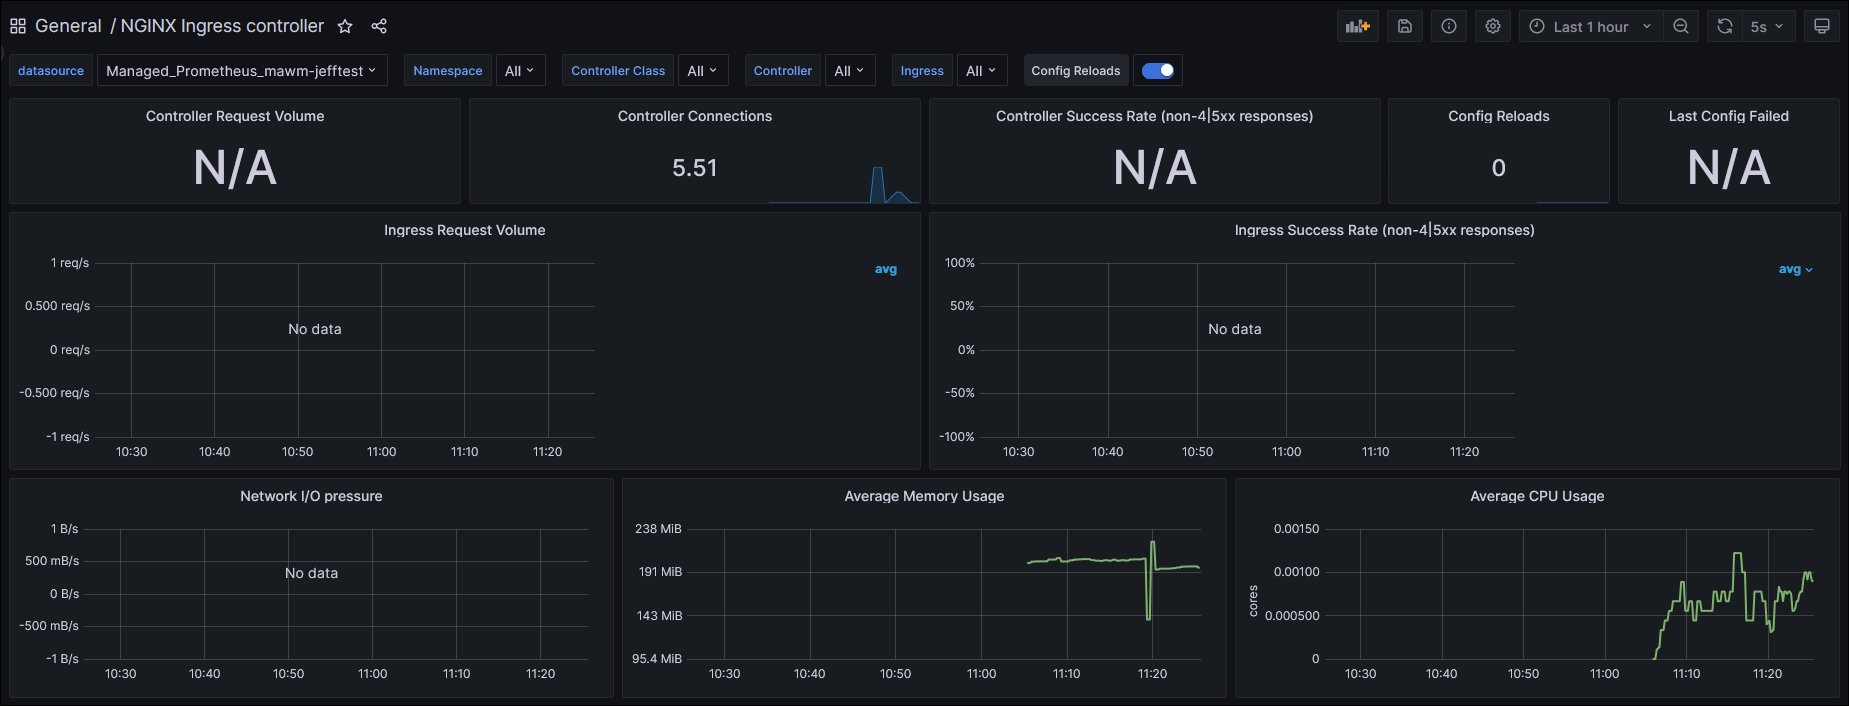
I could now see these dashboards in my Grafana instance, but they were empty:

Taking the next step to solve this problem really bogged down based on my lack of understanding of Prometheus and how it is configured. The default installation of Azure Managed Prometheus and Grafana doesn’t do anything with ingress-nginx metrics out of the box, so I began trying to identify how to get it working. Following through Microsoft Docs (which are typically really great) I came across this page: https://learn.microsoft.com/en-us/azure/azure-monitor/essentials/prometheus-metrics-scrape-configuration

This was quite overwhelming to me. Many options are described, none of which I had knowledge about, or had good use cases defined in the doc page for why you would choose one or the other. There is no indication or example of using these patterns either, which doesn’t make for a good starting point.

I looked next at the pod-annotation-based-scraping setting, found within the “ama-metrics-settings-configmap.yaml” file. I set this to include the name of my workload namespace, as well as where I deployed ingress-nginx: podannotationnamespaceregex = "test|ingress-nginx"

After re-running my Terraform and waiting for the metrics pods to reload (judging by the restart count by a kubectl get pods, this didn’t do anything; the dashboards remained blank.

I looked at the Azure Prometheus troubleshooting doc to get the config interface of Prometheus port forwarded, and after reaching this interface in a web browser, I didn’t see any new targets listed beyond the existing node ones.

After some searching and reading, I came across this post: https://medium.com/microsoftazure/automating-managed-prometheus-and-grafana-with-terraform-for-scalable-observability-on-azure-4e5c5409a6b1
It had an example regarding a prometheus scrape config, which was mentioned in the Azure docs. This makes sense, in that what I originally configured above was a scoping statement for where this scrape config would be applied.

This understanding led me to the ingress-nginx docs which have a sample prometheus scrape config!
https://github.com/kubernetes/ingress-nginx/blob/main/deploy/prometheus/prometheus.yaml

Following the Azure doc for prometheus-metric-scrape-configuration, I created a new file named ama-metrics-prometheus-config-configmap.yaml and populated it with the scrape config found within the ingress-nginx repository.

kind: ConfigMap
apiVersion: v1
data:
  prometheus-config: |-
    global:
      scrape_interval: 30s
    scrape_configs:
      - job_name: 'kubernetes-pods'

        kubernetes_sd_configs:
        - role: pod

        relabel_configs:
        # Scrape only pods with the annotation: prometheus.io/scrape = true
        - source_labels: [__meta_kubernetes_pod_annotation_prometheus_io_scrape]
          action: keep
          regex: true

        # If prometheus.io/path is specified, scrape this path instead of /metrics
        - source_labels: [__meta_kubernetes_pod_annotation_prometheus_io_path]
          action: replace
          target_label: __metrics_path__
          regex: (.+)

        # If prometheus.io/port is specified, scrape this port instead of the default
        - source_labels: [__address__, __meta_kubernetes_pod_annotation_prometheus_io_port]
          action: replace
          regex: ([^:]+)(?::\d+)?;(\d+)
          replacement: $1:$2
          target_label: __address__

        # If prometheus.io/scheme is specified, scrape with this scheme instead of http
        - source_labels: [__meta_kubernetes_pod_annotation_prometheus_io_scheme]
          action: replace
          regex: (http|https)
          target_label: __scheme__

        # Include the pod namespace as a label for each metric
        - source_labels: [__meta_kubernetes_namespace]
          action: replace
          target_label: kubernetes_namespace

        # Include the pod name as a label for each metric
        - source_labels: [__meta_kubernetes_pod_name]
          action: replace
          target_label: kubernetes_pod_name

        # [Optional] Include all pod labels as labels for each metric
        - action: labelmap
          regex: __meta_kubernetes_pod_label_(.+)
metadata:
  name: ama-metrics-prometheus-config
  namespace: kube-system

I deployed this through Terraform with another kubectl_manifest resource, and then forced traffic to my workloads with a looping Invoke-WebRequest in Powershell.

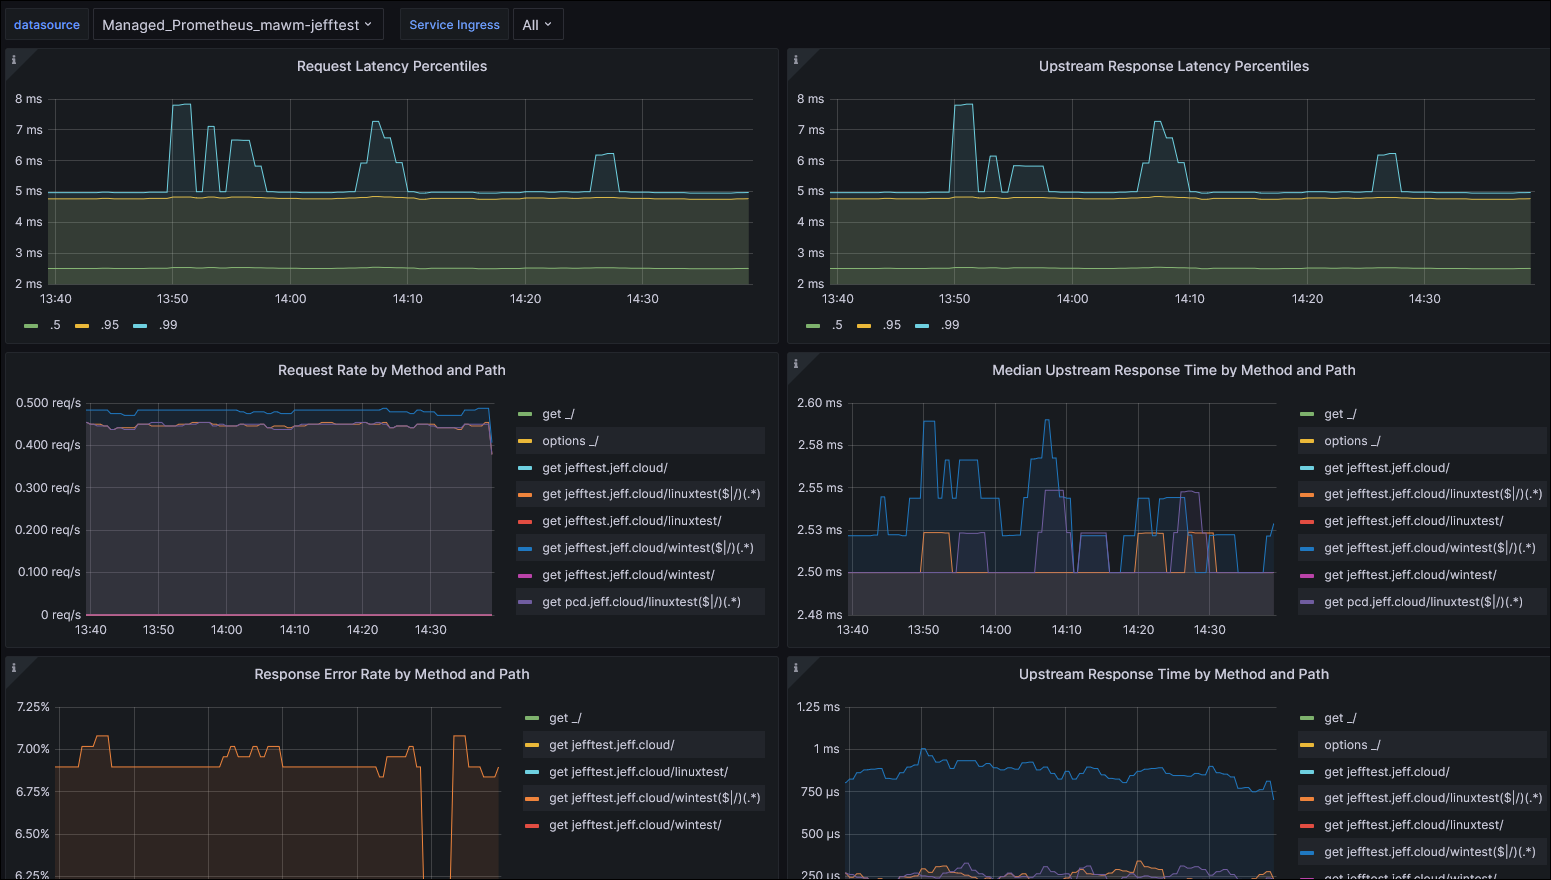
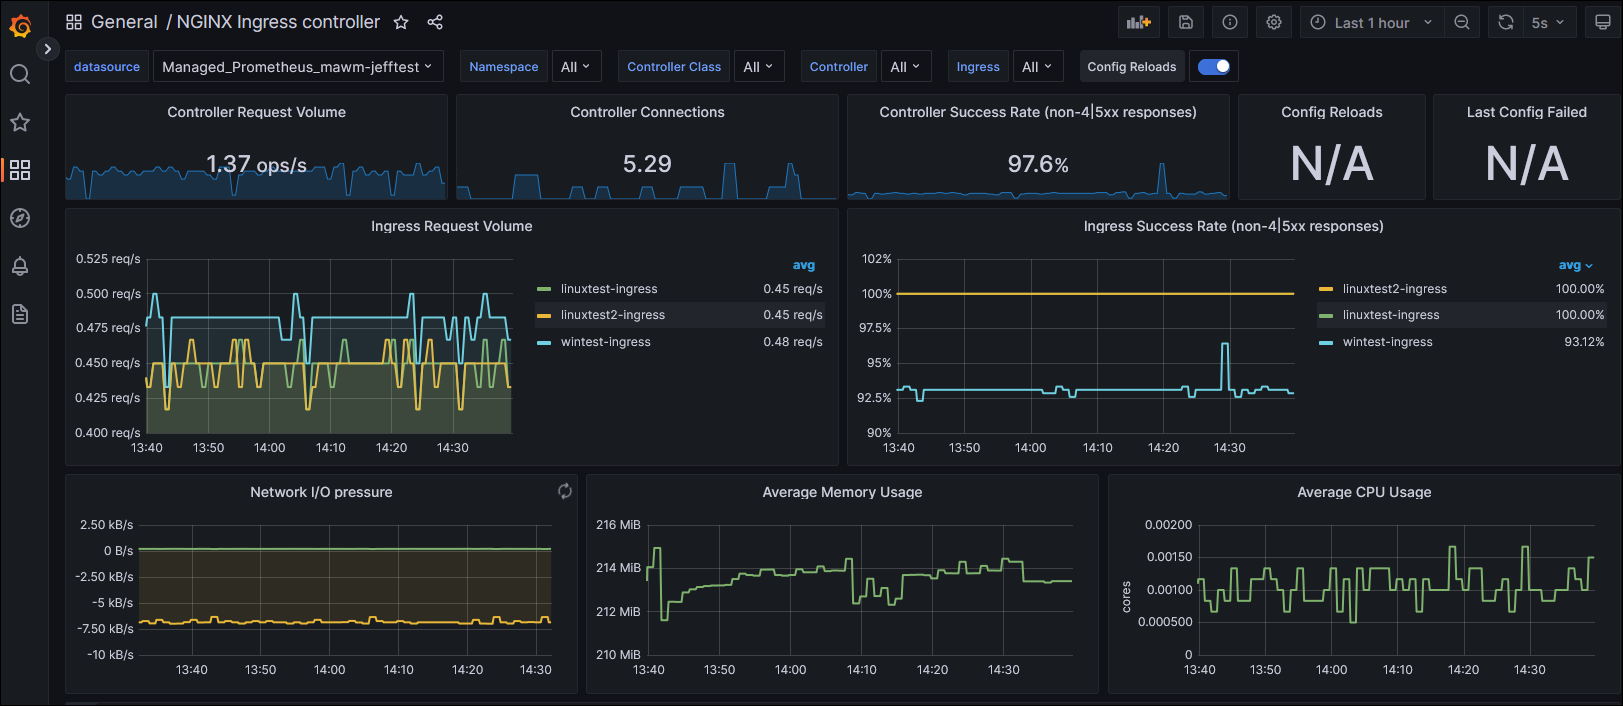
This succeeded! Very quickly I began to see metrics appear within my Grafana dashboards:

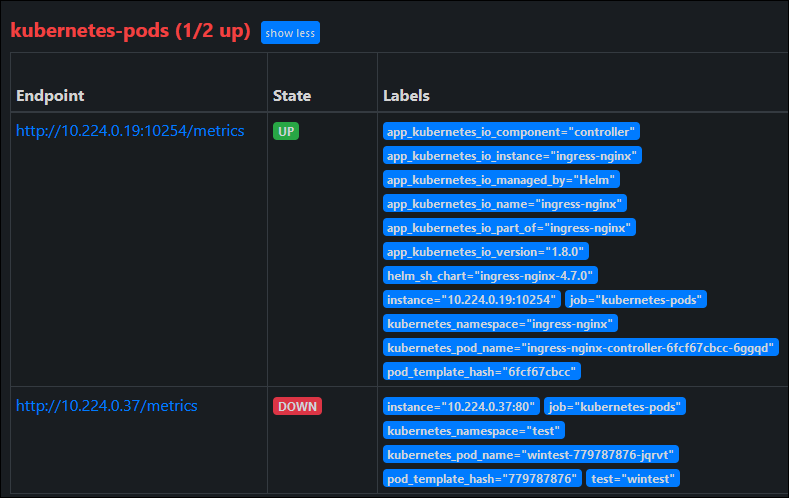
Now when I checked the Prometheus Targets debugging interface, I found an addition for ingress-nginx. You’ll note I also have a “down” entry there for my test workload, which doesn’t have a metrics interface for scraping (but was included in my podannotationnamespaceregex earlier).

Originally I thought that I was going to encounter namespace boundary problems, because the Monitoring docs for ingress-nginx talk about this limitation when using pod scraping. I thought I would be stuck because I am deploying in separate namespaces which indicates the need to use ServiceMonitor objects; and unfortunately the AKS Metrics add-on very-specifically doesn’t support Prometheus Operator CRDs like ServiceMonitor, so we need to use PodAnnotation scraping.

Fortunately after adding the scrape configuration, there wasn’t any further action that I needed to take, so perhaps the described limitation of Prometheus reaching across namespaces is modified by the default Azure deployment.

I’ll drop a link for one more helpful resource, which uses the Prometheus Operator installation and Service Monitors, but helped me gain some understanding of the components of this system: https://techcommunity.microsoft.com/t5/azure-stack-blog/notes-from-the-field-nginx-ingress-controller-for-production-on/ba-p/3781350

Terraform console output

Official doc: https://www.terraform.io/docs/commands/console.html

“terraform console” is a command you can run, which gives you the opportunity to evaluate expressions and interpolation – very useful while building terraform.

To use it, on the command line, navigate to your terraform folder, and then run

terraform console

You will be met with this prompt (which doesn’t support any history through the “up” arrow key ?):

Here you can enter Terraform syntax and press enter to see the results.

Lets take a look at a resource group that exists in my configuration:

I entered in “azurerm_resource_group.mpn-trainlab-rg” and the console output all the properties in the state file for this resource.

I could further define my entry to a single property, and get this:

Now we can try this with some of our input variables. Lets say I have a complicated variable that I’m using to define disks, and I want to make sure when I reference that on a resource, its going to work:

data_disks = {
    ti-web = {
      count = 1
      size  = 64
      sku   = "Standard_LRS"
      caching = "ReadWrite"
    }
    production_u02 = {
      # Take the total data size you want, and divide it by the count of disks you want, to determine size
      count   = 4
      size    = 256
      sku     = "Premium_LRS" # Standard_LRS
      caching = "None"
    }
}

If I enter “var.data_disks” in the console, I would expect to get the exact same output as the code above, in JSON notation (lots of extra quotes and colons).

What if I’m trying to get the size of just the ti-web disk?

Looks like it works! Now I know on the resource for the “size” property, I can use “var.data_disks.ti-web.size” as a reference and it will provide my expected value.

Terraform plan output to file

A quick note to myself on how to get terraform plan output as a file.

By default running a “terraform plan” will output a nice graphical display of all expected changes. Sometimes you want to be able to distribute this as a file. In the past, I’ve tried commands like:

terraform plan > tfplan.txt

However that produces confusing output like this:


Instead, you can do this to get better output:

terraform plan -no-color > tfplan.txt

Now it will display in the console, and produce a text file that looks like this:

Terraform and Azure DNS apex A record

I have a use case for an Azure DNS Private Zone, with an apex A record. For example, I have the name “test.domain.com” and for the VNET that I link to my private zone, I want it to ONLY resolve “test” for domain.com, but go out to the DNS hierarchy for any other records within “domain.com”.

This can be created directly in the Azure portal, by leaving the “Name” field empty when creating a record set. This will produce an apex record, like this:

I want to deploy this through Terraform, so I first tried to leave an empty string in the Name property (because Name is a required field on the AzureRM provider):

resource "azurerm_private_dns_a_record" "test-domain-com-apex" {
    name                = ""
    zone_name           = azurerm_private_dns_zone.test-domain-com.name
    resource_group_name = azurerm_resource_group.shared-rg.name
    ttl                 = 300
    records             = ["10.9.3.230"]
}

However, AzureRM provider doesn’t like that:

So then I went to the Portal, and did an “Export Template” to view the ARM resource natively. Here I found a syntax that appeared to be “zone-name/@”.

I tried this in Terraform:

resource "azurerm_private_dns_a_record" "test-domain-com-apex" {
    name                = "${azurerm_private_dns_zone.test-domain-com.name}/@"
    zone_name           = azurerm_private_dns_zone.test-domain-com.name
    resource_group_name = azurerm_resource_group.shared-rg.name
    ttl                 = 300
    records             = ["10.9.3.230"]
}

However, this wasn’t valid and produced strange output:

Next I tried just the @ symbol:

resource "azurerm_private_dns_a_record" "test-domain-com-apex" {
    name                = "@"
    zone_name           = azurerm_private_dns_zone.test-domain-com.name
    resource_group_name = azurerm_resource_group.shared-rg.name
    ttl                 = 300
    records             = ["10.9.3.230"]
}

This worked!

Now I can selectively resolve specific FQDNs within my VNET without having to worry about records outside that scope.

Terraform nested for_each example

Today I needed a double for_each in my Terraform configuration; the ability to for_each over one thing, and at the same time for_each over another thing.

Here’s the context:

I want to produce two Azure Private DNS Zones, with records inside each of them, but conditionally. Think of it as ‘zones’ – zone A and zone B will be unique in their identifiers, but have commonalities in the IP addresses used.

I want do to this conditionally (a zone may not always exist) but also without repeating myself in code.

Lets start with a variable Map of my zones:

variable "zoneversions" {
  default = {
        "zonea" = {
            "zonename" = "a",
            "first3octets" = "10.9.3"
        },
        "zoneb" = {
            "zonename" = "b",
            "first3octets" = "10.9.4"
        }
    }
}

Here I’m creating an object that will work with for_each syntax. You’ll note I’m including additional attributes that are unique to each zone – this will come in handy later.

This variable allows me to create my Azure DNS private zones like this:

resource "azurerm_private_dns_zone" "zones-privatedns" {
  for_each            = var.zoneversions
  name                = "${each.value.zonename}.domain.com"
  resource_group_name = azurerm_resource_group.srv-rg.name
  }
}

This is using the “each.value” syntax, referencing the attributes of each zone. This terraform will produce the Private DNS zones described in the image above.

Now I want to populate each zone with records.
First, I’m going to use a local variable (could be a regular variable too) that will create a map of keys (common parts of server names) and values (last octet of the ip addresses):

locals {
  ipaddresses = {
    web                = ".3"
    rdp                = ".4"
    dc                 = ".10"
    db                 = ".11"
  }
}

For each zone that I have (a or b), I want to create a DNS record for each key in this map (hence the double for_each). Terraform won’t let you combine a for_each and count, and it doesn’t natively support 2 for_each expressions.

After a lot of trial and error (using terraform console to test) I came up with the code below. This article with a post by ‘apparentlysmart’ was a big help in the final task and helped me understand the structure of what I was trying to build.

I need 2 new local variables. The first will produce a flattened list of the combinations I’m looking for. And then since for_each only interacts with maps, I need a second local to convert it into that object type.

zonedips-list = flatten([ # Produce a list of maps, containing a name and IP address for each zone we specify in our variable
    for zones in var.zoneversions: [
      for servername,ips in local.ipaddresses: {
        zonename = "${zones.zonename}"
        name = "${zones.zonename}${servername}"
        ipaddress = "${zones.first3octets}${ips}"
      }
    ]
  ])

  zonedips-map = { # Take the list, and turn it into a map, so we can use it in a for_each
    for obj in local.zonedips-list : "${obj.name}" => obj # this means set the key of our new map to be $obj.name (hfx23-ti-web1) and => means keep the attributes of the object the same as the original
  }

Then I can use that second local when defining a single “azurerm_private_dns_a_record” resource:

resource "azurerm_private_dns_a_record" "vm-privaterecords" {
  for_each            = local.zonedips-map
  name                = each.value.name
  zone_name           = azurerm_private_dns_zone.zones-privatedns[each.value.zonename].name
  resource_group_name = azurerm_resource_group.srv-rg.name
  ttl                 = 300
  records             = [each.value.ipaddress]
}

This is where the magic happens. Because my map “zonedips-map” has attributes for each object, I can reference them with the ‘each.value’ syntax. So the name field of my DNS record will be equivalent to “${zones.zonename}${servername}”, or “aweb/bweb” as the for_each iterates. To place these in the correct zone, I’m using index selection on the resource, within the “zone_name” attribute – this says refer to the private_dns_zone with the terraform identifier “zones-privatedns” but an index (since there are multiple) that matches my version name.

This is where terraform console comes in real handy; I can produce a simple terraform config (without an AzureRM provider) that contains these items, with either outputs, or a placeholder resource (like a file).

For example, take the terraform configuration below, do a “terraform init” on it, and then “terraform console” command.

terraform {
  backend "local" {
  }
}

locals {
  zonedips-list = flatten([
    for zones in var.zoneversions: [
      for servername,ips in local.ipaddresses: {
        zonename = "${zones.zonename}"
        name = "${zones.zonename}${servername}"
        ipaddress = "${zones.first3octets}${ips}"
      }
    ]
  ])

  zonedips-map = {
    for obj in local.zonedips-list : "${obj.name}" => obj
  }

  ipaddresses = {
    web                = ".3"
    rdp                = ".4"
    dc                 = ".10"
    db                 = ".11"
  }
}

variable "zoneversions" {
  default = {
        "zonea" = {
            "zonename" = "a",
            "first3octets" = "10.9.3"
        },
        "zoneb" = {
            "zonename" = "b",
            "first3octets" = "10.9.4"
        }
    }
}

resource "local_file" "test" {
    for_each = local.zonedips-map
    filename    = each.value.name
    content     = each.value.ipaddress
}

You can then explore and display the contents of the variables or locals by calling them explicitly in the console:

So we can display the contents of our flattened list:

And then the produced map:


Finally, we can do a “terraform plan”, and look at the file resources that would be created (I shrunk this down to just 2 items for brevity):

You can see the key here in the ‘content’ and ‘filename’ attributes.